SEO
Digital Analytics
Social Media Strategy
Amon Carter Museum of American Art
Transforming Museum Analytics into Strategic Action
Over six weeks, I partnered with teammates Gloria Yang and Kevin Zhang to conduct a comprehensive digital analytics audit across website performance, SEO optimization, and social media strategy. I led the GA4 traffic analysis and Instagram performance evaluation, uncovering critical attribution issues affecting 30K+ users and audience insights that informed our strategic recommendations to resolve technical barriers, strengthen organic search visibility, and expand engagement with the critical 18–34 demographic.
Timeline
Oct. 16 - Dec. 4, 2025 (1.5 months)
My Role
Data Analyst and Researcher
Skills
Interviews, User research, Data analysis and Visualization, Qualitative Research, SEO and Social Media Analysis
Team size & Members
3 (Me, Gloria Yang, Kevin Zhang)
project Scope
Web performance & sEO
Audited SEO performance and GA4 data to identify visibility gaps, support the upcoming website refresh with stronger content findability, and integrate early AI search optimization considerations.
Social Media (Instagram)
Evaluated content performance and audience reach using Meltwater data to identify expansion opportunities among younger demographics (18-34) and provide a scalable framework for future social tracking.
Dashboard Improvement
Refreshed interpretation of existing analytics reports and proposed an actionable dashboard structure that delivers clear, prioritized recommendations for stronger visibility, engagement, and long-term digital growth.
My Role in the Project
I led two critical areas—GA4 traffic analysis and Instagram performance evaluation—while contributing to the broader team effort on SEO and web performance insights.
Primary responsibilities:
- GA4 attribution modeling and traffic source analysis
- Bot traffic detection and data quality assessment
- Instagram content performance analysis and audience insights
- Dashboard component development and metric visualization
Collaborative contributions:
- Assisted with SEO insights from PageSpeed and keyword opportunity analysis
- Supported in connecting performance metrics to user behavior patterns
- Integrated findings across all channels into unified strategic narrative
background
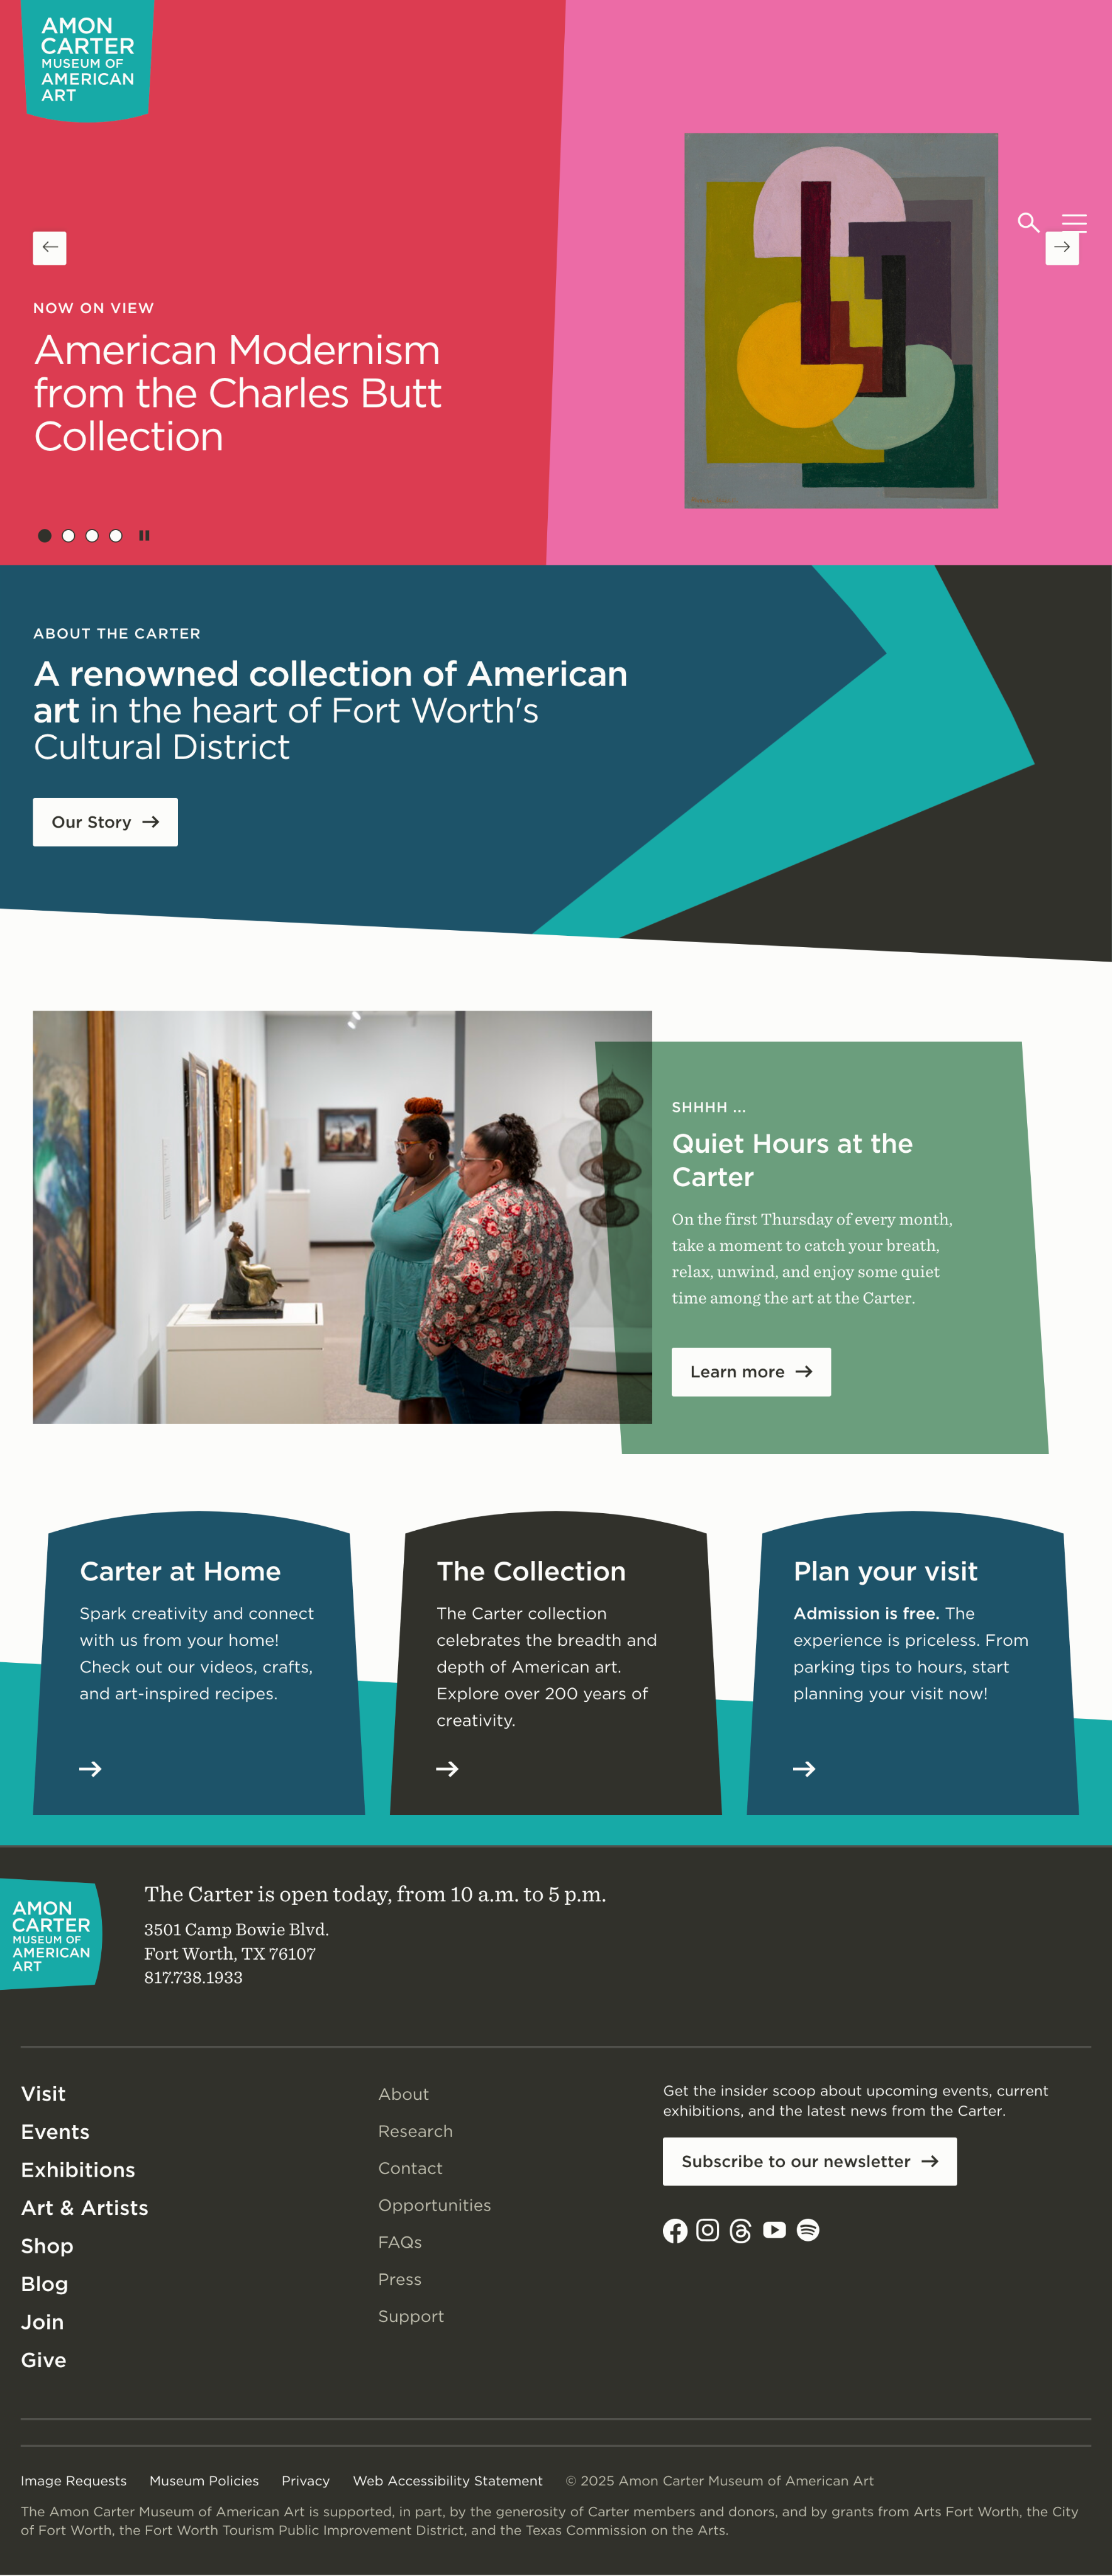 Current Amon Carter Museum Homepage
Who's Amon Carter Museum of American Art?
Amon Carter Museum of American Art stands as Fort Worth's premier institution celebrating American creativity from the 18th century through contemporary works. Established in 1961, the museum houses an expansive permanent collection featuring iconic Western art, photography, and American paintings while offering free admission to all visitors—a commitment that shapes both its accessibility mission and its unique digital analytics challenges. Unlike ticket-selling institutions, it operates as a free-access educational resource where success is measured not in revenue, but in community engagement, educational impact, and long-term audience cultivation toward membership and donor support.
The museum's digital ecosystem features a comprehensive website offering searchable collection databases, teacher resource libraries for educators, event registration, and exhibition information, alongside an active Instagram presence serving 26,500 followers with collection highlights, behind-the-scenes content, and program promotion that reaches diverse audiences across multiple digital touchpoints.
The museum's digital ecosystem features a comprehensive website offering searchable collection databases, teacher resource libraries for educators, event registration, and exhibition information, alongside an active Instagram presence serving 26,500 followers with collection highlights, behind-the-scenes content, and program promotion that reaches diverse audiences across multiple digital touchpoints.
Who Uses the Website?
General Visitors and Families
Explore exhibitions, event schedules, and visit resources to enrich both on-site and virtual experiences. Family-oriented content facilitates discovery and engagement at all ages.
Educators and Teachers
Access lesson plans, classroom activities, and specialized educator resources to support dynamic, art-driven learning experiences.
Art Enthusiasts and Collectors
Browse collection highlights, learn about new acquisitions and exhibitions, and find programs to deepen their appreciation of American art.
Artists and Community Partners
Participate in community artist programs, collaborative initiatives, and events that strengthen ties within the vibrant North Texas arts scene.
CHALLENGE & Goal
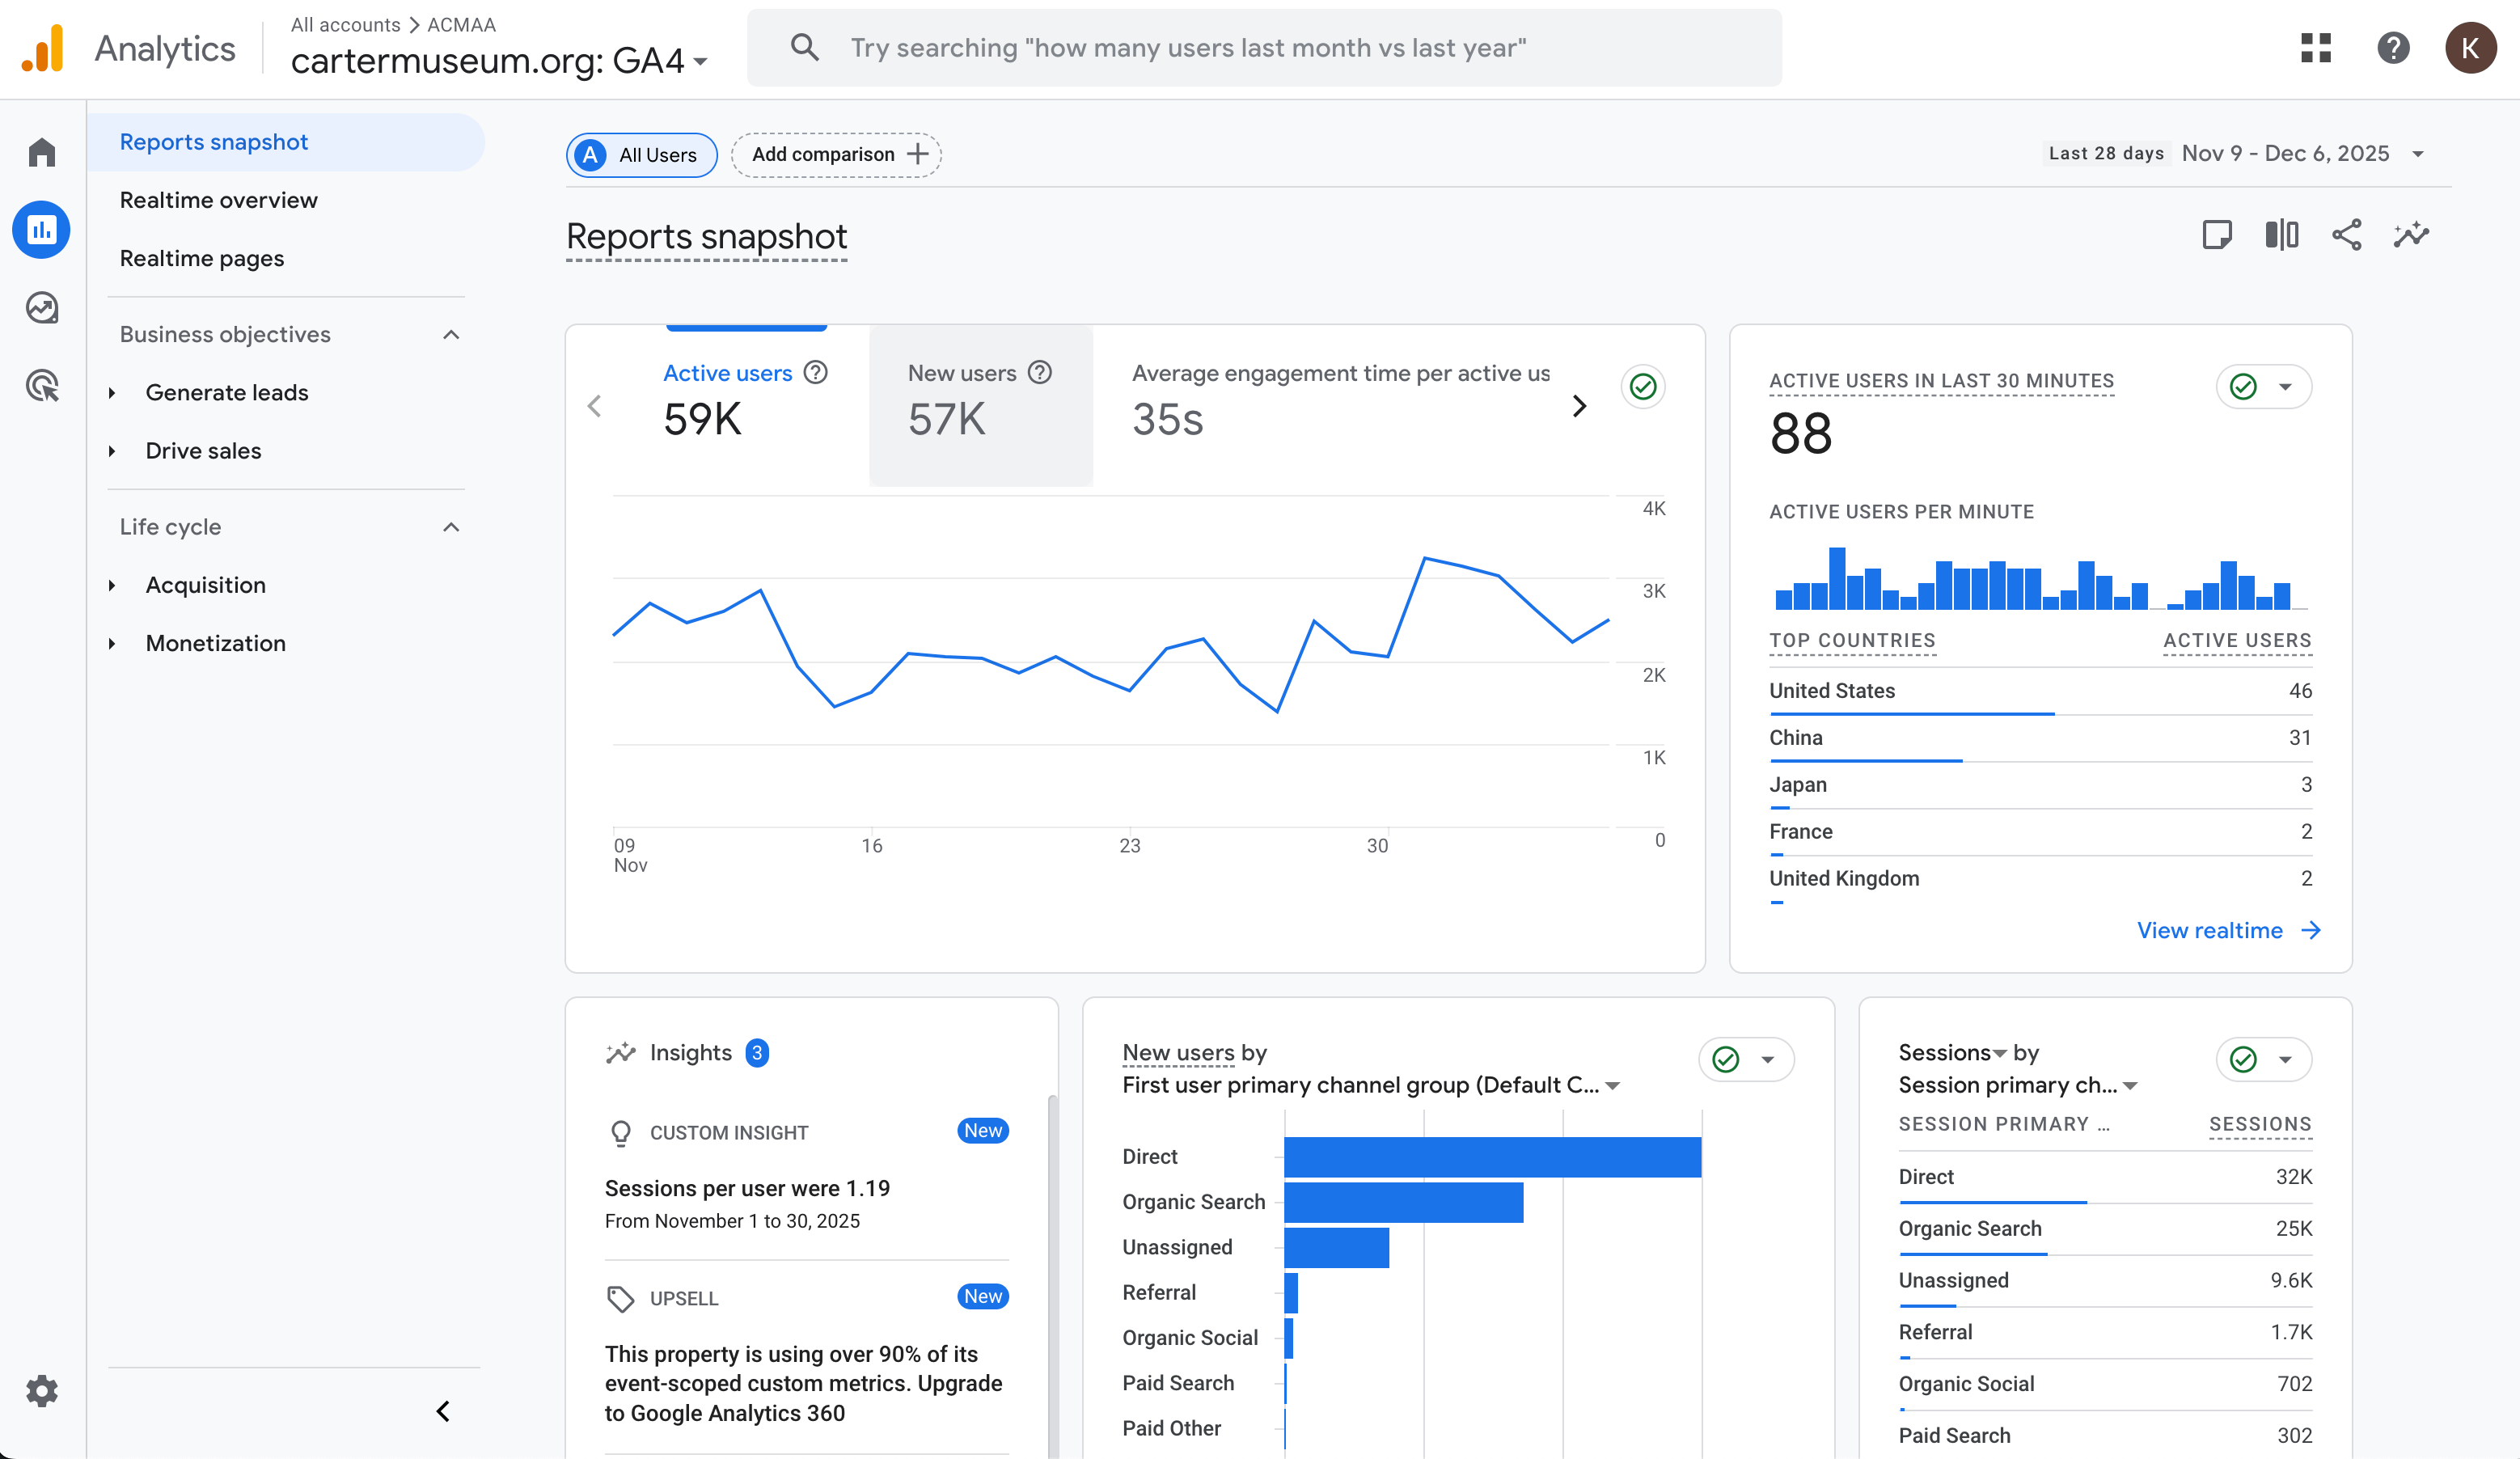 Current Carter Museum GA4
The Problem
The Amon Carter Museum generated massive digital engagement across website and social media, but broken analytics infrastructure and data quality issues prevented strategic decision-making about audience development and content optimization
The museum's disjointed analytics ecosystem obscured critical insights needed to guide digital strategy. With 67,566 monthly website users and 26,500 Instagram followers, the client had been "taking analytics from one place to the next" across different museum positions without critically evaluating whether they were tracking the right metrics. Essential questions about attribution, audience demographics, and content performance remained unanswered due to fragmented tracking systems inherited during the Google Analytics 4 migration.
The team encountered inflated traffic metrics that "felt wrong," unexplained gaps in campaign attribution that made marketing ROI invisible, and demographic data that contradicted their lived experience with actual museum visitors. Without clean, trustworthy data, the museum couldn't confidently answer its most strategic question: how do we cultivate younger audiences (18-34 years old) when they currently represent less than 10% of digital engagement?
The team encountered inflated traffic metrics that "felt wrong," unexplained gaps in campaign attribution that made marketing ROI invisible, and demographic data that contradicted their lived experience with actual museum visitors. Without clean, trustworthy data, the museum couldn't confidently answer its most strategic question: how do we cultivate younger audiences (18-34 years old) when they currently represent less than 10% of digital engagement?
project Goals
Diagnose Analytics Infrastructure and Data Quality
Audit Google Analytics 4 implementation, attribution frameworks, and existing dashboards while identifying critical data quality issues that create unreliable metrics and prevent confident strategic decisions.
Evaluate Audience Behavior and Content Performance
Determine how effectively the museum reaches and engages target demographics across web and social platforms to identify high-performing content patterns and untapped opportunities for younger audience development.
Develop Actionable Optimization Roadmap
Analyze current digital strategy gaps in website UX, SEO positioning, and social media approach and deliver prioritized recommendations that maximize impact within the museum's resource constraints.
Research
We conducted comprehensive digital analytics audits across multiple data sources—Google Analytics 4, SEMrush, Meltwater social listening, and existing Looker Studio dashboards—to diagnose data quality issues and identify optimization opportunities for website traffic, SEO positioning, and social media performance.
Our team worked collaboratively to analyze the museum's digital ecosystem: I led GA4 traffic analysis and Instagram performance evaluation, Kevin conducted SEO technical audits and keyword research, and Gloria analyzed web performance metrics. I also contributed to interpreting SEO findings and connecting performance data to user behavior patterns.
We synthesized data from 67,566 monthly website users, 20,513 organic keywords, and 26,500 Instagram followers to uncover attribution gaps, data contamination issues, and content performance patterns that would inform strategic recommendations.
How did we Analyze the Digital Presence?
1. Client Kick-Off Meeting
Met with client’s digital content team to secure analytics access, review existing KPIs, identify tracking gaps, and align on goals and audience priorities. The team admitted they had been "taking analytics from one place to the next" without questioning methodology—metrics "felt wrong" but they lacked technical expertise to diagnose why. The core challenge: cultivating younger audiences (18-34) to build long-term member and donor pipeline as the 60+ core audience ages out.
2. SEO, Social, & Web Performance Audit
We analyzed SEMrush, PageSpeed Insights, GA4, and Instagram data from Meltwater to conduct a full SEO, social, and web performance audit. This helped to uncover technical and content barriers affecting overall visibility and findability.
- SEO: Found 20,513 keywords with 41% in positions 21-100, domain authority split across 4 URL variants, 80% empty anchor backlinks.
- Web Performance: Mobile score 36/100, LCP 18.4 seconds, connected to event page bounce (20,065 views, 10.6% deep engagement).
- Instagram: Audience 56% aged 35-54, carousels outperform static by +56% engagement but only 14% of content, 17 reels annually, 0.008% CTR to website.
- GA4: 30,000+ "Unassigned" users (20% of traffic), 14% bot contamination, demographic data contradicting assumptions.
- Dashboard Audit: Broken charts from GA4 migration, bot-inflated metrics, unexplained traffic categories, incomplete conversion funnels.
3. KPI Framework & Dashboard Development
We defined a focused KPI structure aligned to the museum's free-admission model and proposed an actionable dashboard structure for clearer insights and decision-making. Since traditional e-commerce metrics don't apply, we developed alternative measures: audience development (demographic shifts toward 18-34), engagement depth (time on collection pages), program participation (event RSVP conversion), and social discovery (non-follower reach, profile visits).
Designed three dashboard components: Clean Traffic View (bot exclusion filter), Attribution Clarity Note (explaining "Unassigned"), and Event Conversion Funnel (full-path visualization from views to RSVPs).
Designed three dashboard components: Clean Traffic View (bot exclusion filter), Attribution Clarity Note (explaining "Unassigned"), and Event Conversion Funnel (full-path visualization from views to RSVPs).
4. Synthesis and Strategic Recommendations
We synthesized findings from all phases and delivered prioritized and practical recommendations that improve digital visibility and reporting accuracy. Organized into three tiers based on impact and resource requirements:
- Quick Wins: Fix attribution infrastructure (UTM framework for 30K "Unassigned" users), enable bot filtering (reveal accurate engagement metrics), activate Instagram Reels strategy (17 → 150-200 annually).
- Medium-Term: Redesign event CTAs (5% → 12-15% conversion), expand non-branded SEO content, optimize page performance (36 → 70+ mobile score).
- Long-Term: Resolve technical SEO foundation (consolidate 4 URL variants), develop AI search readiness (structured content for generative engines).
findings &
Recommendations
Recommendations
SEO Analysis
INDEXING
Duplicate Domains Diluting Authority & Causing Tracking Errors
Google is currently indexing four versions of the domain (http/https + www/non-www). Because of this, the site’s authority is being split across four different URLs instead of one. This makes it harder for Google to understand which version to rank, weakens overall search visibility. It also reduces how well AI search systems recognize and surface Amon Carter content.
Recommendation
Consolidate all domain variants into a single canonical version to centralize traffic, strengthen CTR performance, and ensure all authority flows to one unified URL. This reduces confusion for search engines, prevents dilution of ranking signals, and improves how consistently pages appear and perform in both traditional and AI-driven search results.
SEO Analysis
KEYWORD
Strong Branded Visibility, Limited Non-Branded Discoverability
The website ranks very well for branded keywords, confirming strong brand recognition. However, most non-branded keywords rank in positions 21–100, and only 863 keywords trigger SERP features. This reduces the museum’s visibility for broader topics, meaning new audiences are far less likely to discover the museum organically.
Recommendation
Expand non-branded visibility by strengthening content depth and technical SEO. Build out evergreen informational resources, including exhibit explainers, artist pages, “Plan Your Visit” content, and teacher resource hubs, to better match informational search intent and increase impressions and CTR. Improve on-page SEO by refining metadata, adding long-tail keywords, and strengthening internal linking from high-authority pages to elevate mid-ranking content. Additionally, implement FAQs and structured data across key landing, exhibit, and event pages to capture SERP features and improve rich-result visibility.
SEO Analysis
BACKLINK
backlinks are missing anchor text
78% of backlinks use empty anchors with no context, and a large share comes from artsandculturetx.com and glasstire.com. Additionally, 73% of all backlinks are image-type, providing little descriptive text for search engines to understand topical relevance.
This lack of meaningful anchor text weakens non-branded authority, making it harder for the Carter to rank for themes beyond its name.
This lack of meaningful anchor text weakens non-branded authority, making it harder for the Carter to rank for themes beyond its name.
Recommendation
Work with top referring domains to replace empty or image-only backlinks with meaningful, descriptive anchor text. Encourage partners to use anchors that reference exhibit titles, artist names, Fort Worth art terms, or key thematic phrases. This will give Google clearer semantic signals, strengthen the museum’s topical authority beyond branded terms, and improve visibility for non-branded searches such as exhibits, events, and educational resources.
SEO Analysis
PAGE SPEED
Slow Page Speed on Both Platforms
PageSpeed Insights shows:
Large, uncompressed images, unused JavaScript, render-blocking scripts, and mismatched image dimensions are causing slowdown. These issues significantly impact Largest Contentful Paint (LCP), Total Blocking Time (TBT), and overall site engagement.
- Desktop performance: 47
- Mobile performance: 36
Large, uncompressed images, unused JavaScript, render-blocking scripts, and mismatched image dimensions are causing slowdown. These issues significantly impact Largest Contentful Paint (LCP), Total Blocking Time (TBT), and overall site engagement.
Recommendation
Optimize site performance by reducing large image file sizes, converting assets to next-gen formats (WebP/AVIF), and ensuring all images match their rendered display dimensions to prevent layout shifts. Remove unused JavaScript and defer non-critical scripts to eliminate render-blocking behavior. These improvements will meaningfully enhance LCP, TBT, and overall page load speed across both desktop and mobile.
Web Performance
Attribution
Direct Traffic Nearly Equals Organic Search
Google Analytics shows 52K new users labeled as “Direct,” nearly matching Organic Search (59K). This pattern is not typical for a museum website and indicates that a significant portion of marketing traffic is being misattributed. Missing UTM parameters, redirect chains, or tracking inconsistencies are causing email, social, and paid campaigns to be lumped into “Direct,” preventing accurate performance measurement and strategic planning.
Recommendation
Fix redirect chains and standardize tracking across all marketing channels. Ensure every outbound asset, such as newsletters, social posts, paid ads, partner listings, and print-to-site QR codes, uses consistent and unique UTM parameters. Test all campaign landing pages to confirm parameters persist through redirects. This will clarify attribution, reduce inflated “Direct” traffic, and restore accurate channel-level performance insights.
Web Performance
data integrity
Bot/Spam Traffic from Chinese Cities Severely Distorts Analytics
Bot traffic causes the reported bounce rate to be artificially higher and the average session duration is artificially lower. We cannot accurately judge content quality until this is filtered.
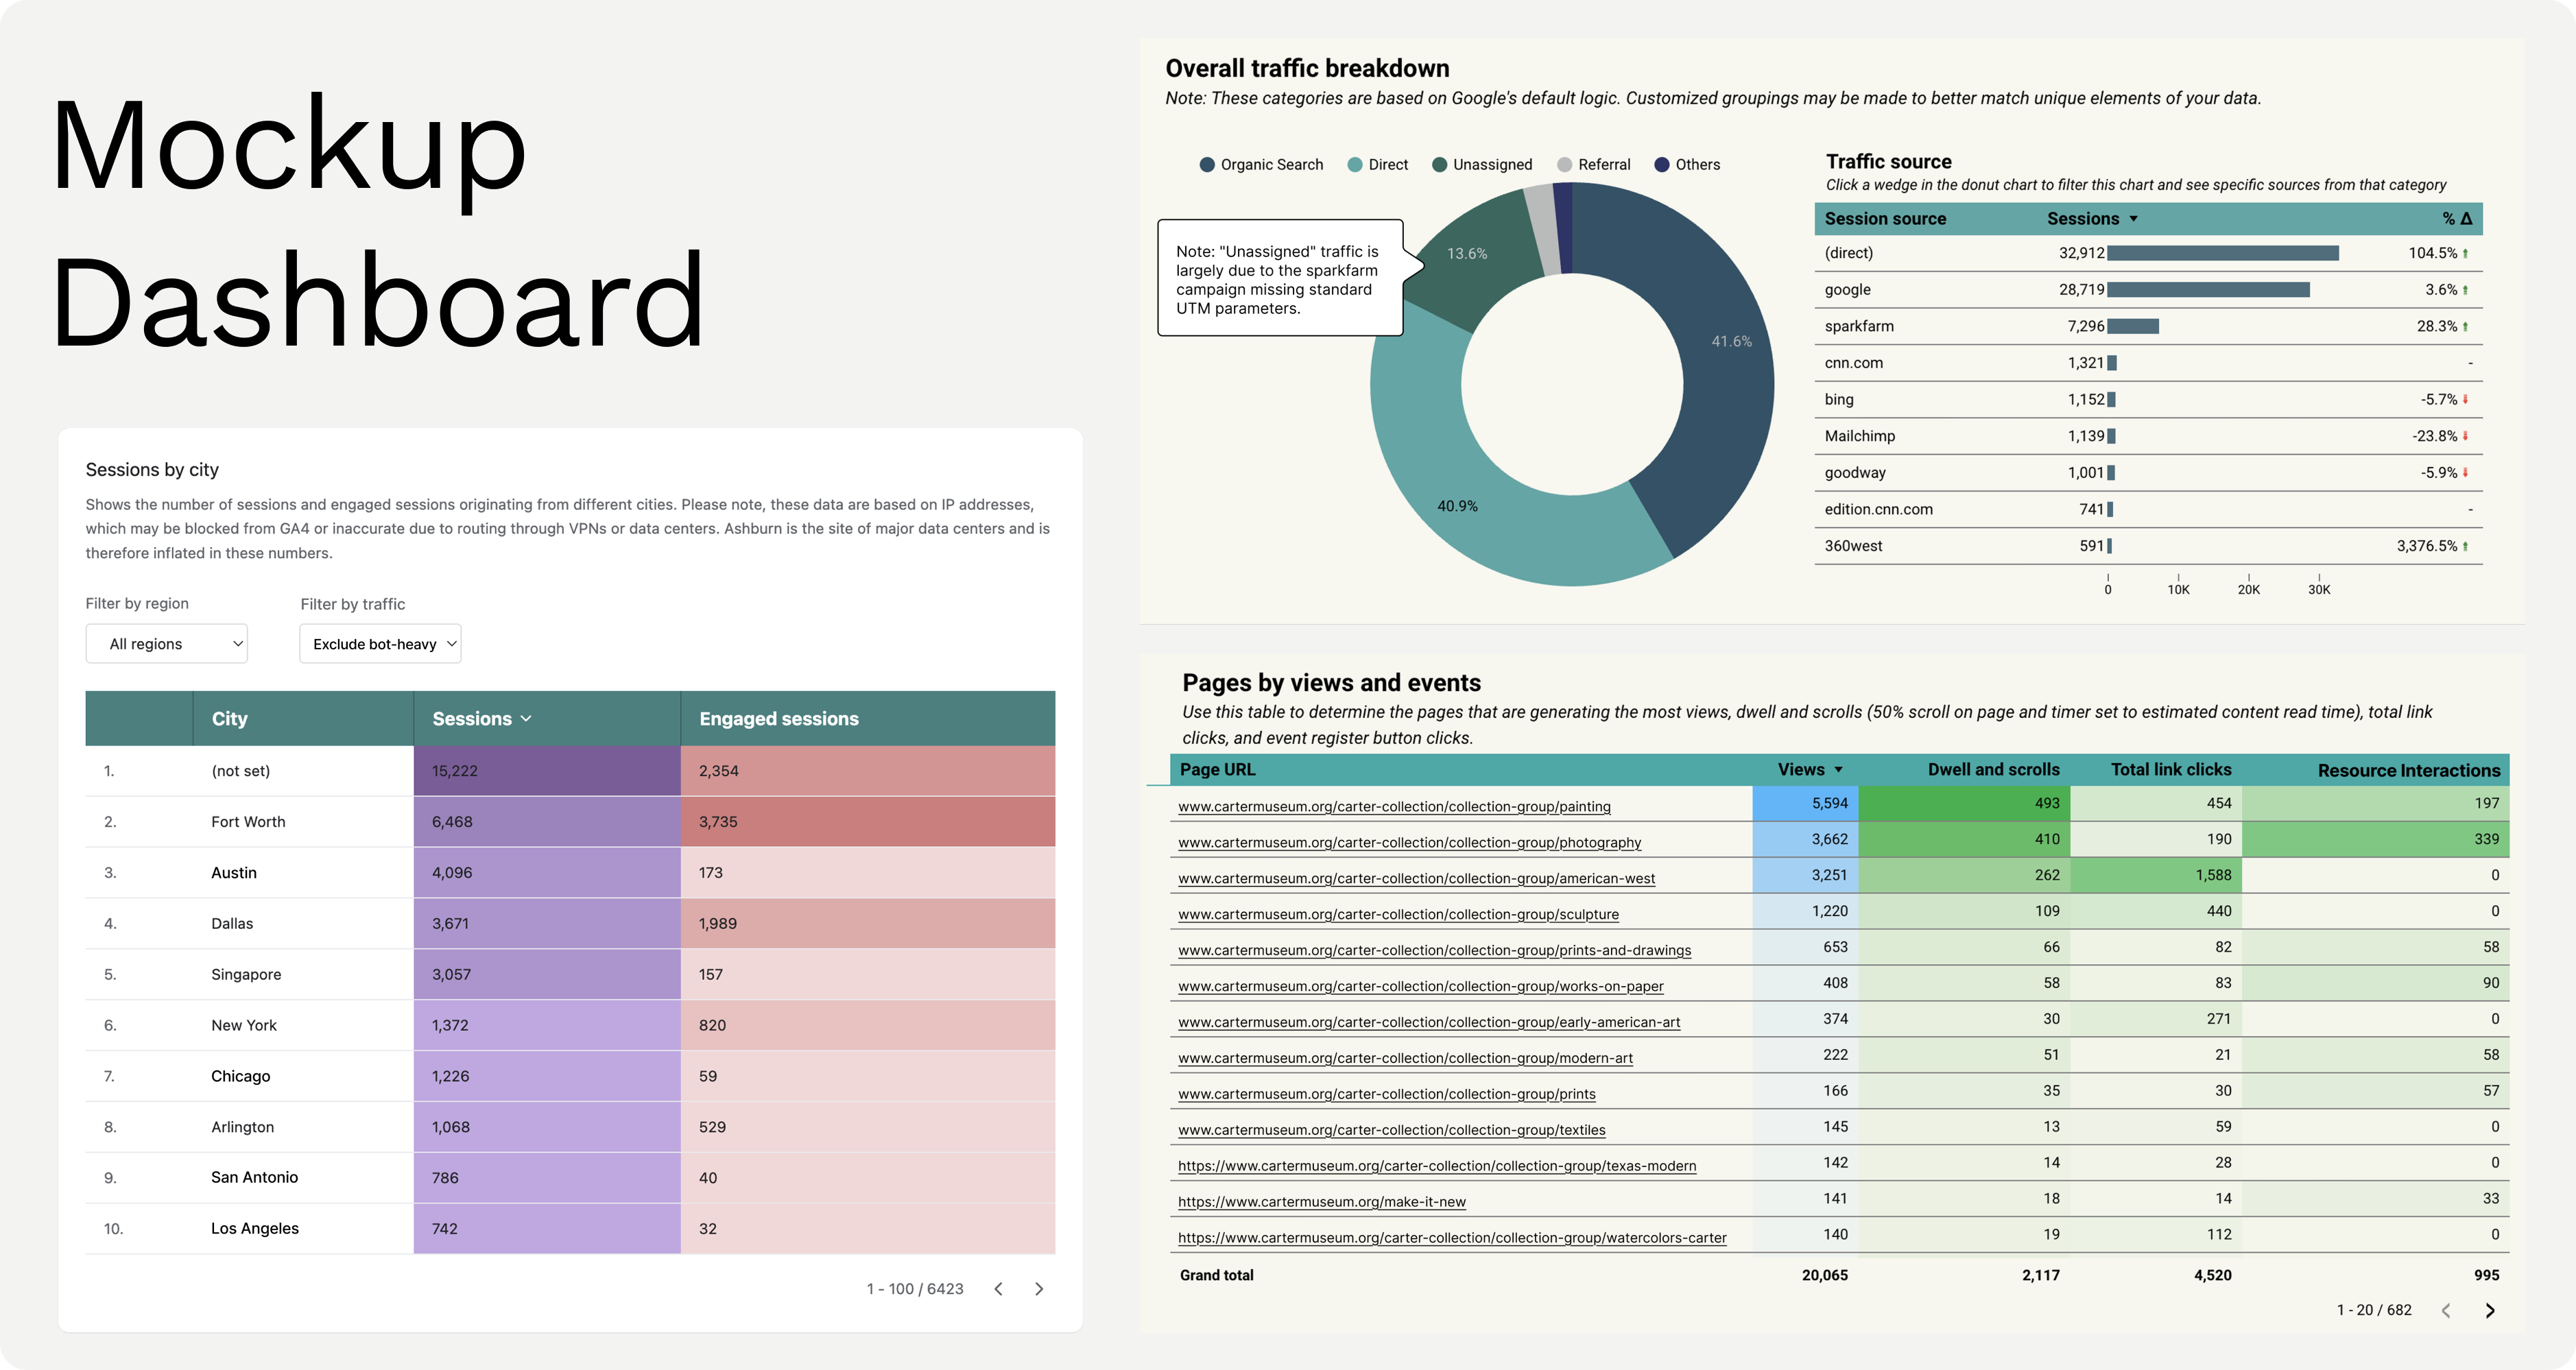
Hence, large volume of sessions is coming from cities such as Lanzhou, Shanghai, Hangzhou, Guangzhou, and Singapore, all showing extremely low engagement rates (4–5%) compared to local audiences in Fort Worth (58%) and Dallas (54%).
Hence, large volume of sessions is coming from cities such as Lanzhou, Shanghai, Hangzhou, Guangzhou, and Singapore, all showing extremely low engagement rates (4–5%) compared to local audiences in Fort Worth (58%) and Dallas (54%).
Recommendation
Enable GA4’s enhanced bot filtering and apply geographic exclusion filters to remove traffic from suspected bot-heavy locations (e.g., Lanzhou, Shanghai, Hangzhou, Guangzhou, Singapore). This will clean the dataset, prevent inflated session numbers, and restore accurate engagement and performance metrics needed for reliable reporting and strategic decision-making.
Web Performance
TRACKING
Unassigned Traffic Comprises 20% of New Users
The “Unassigned” channel group accounts for 30K of 148K new users, indicating a significant chunk of sessions are not being attributed to proper channel sources, which obscures marketing performance data and hinders optimization. This may be due to missing or inconsistent UTM tagging across inbound links, redirects stripping parameters, or custom sources that don’t match GA4 channel mapping.
Recommendation
Audit all major inbound traffic sources to identify missing or inconsistent UTM parameters, especially across newsletters, social posts, partner links, print-to-digital assets, and paid campaigns. Standardize UTM usage across teams and update GA4 channel group definitions so sessions are routed into the correct marketing channels. This ensures accurate attribution, clearer performance insights, and better optimization of future campaigns.
Web Performance
CONVERSION
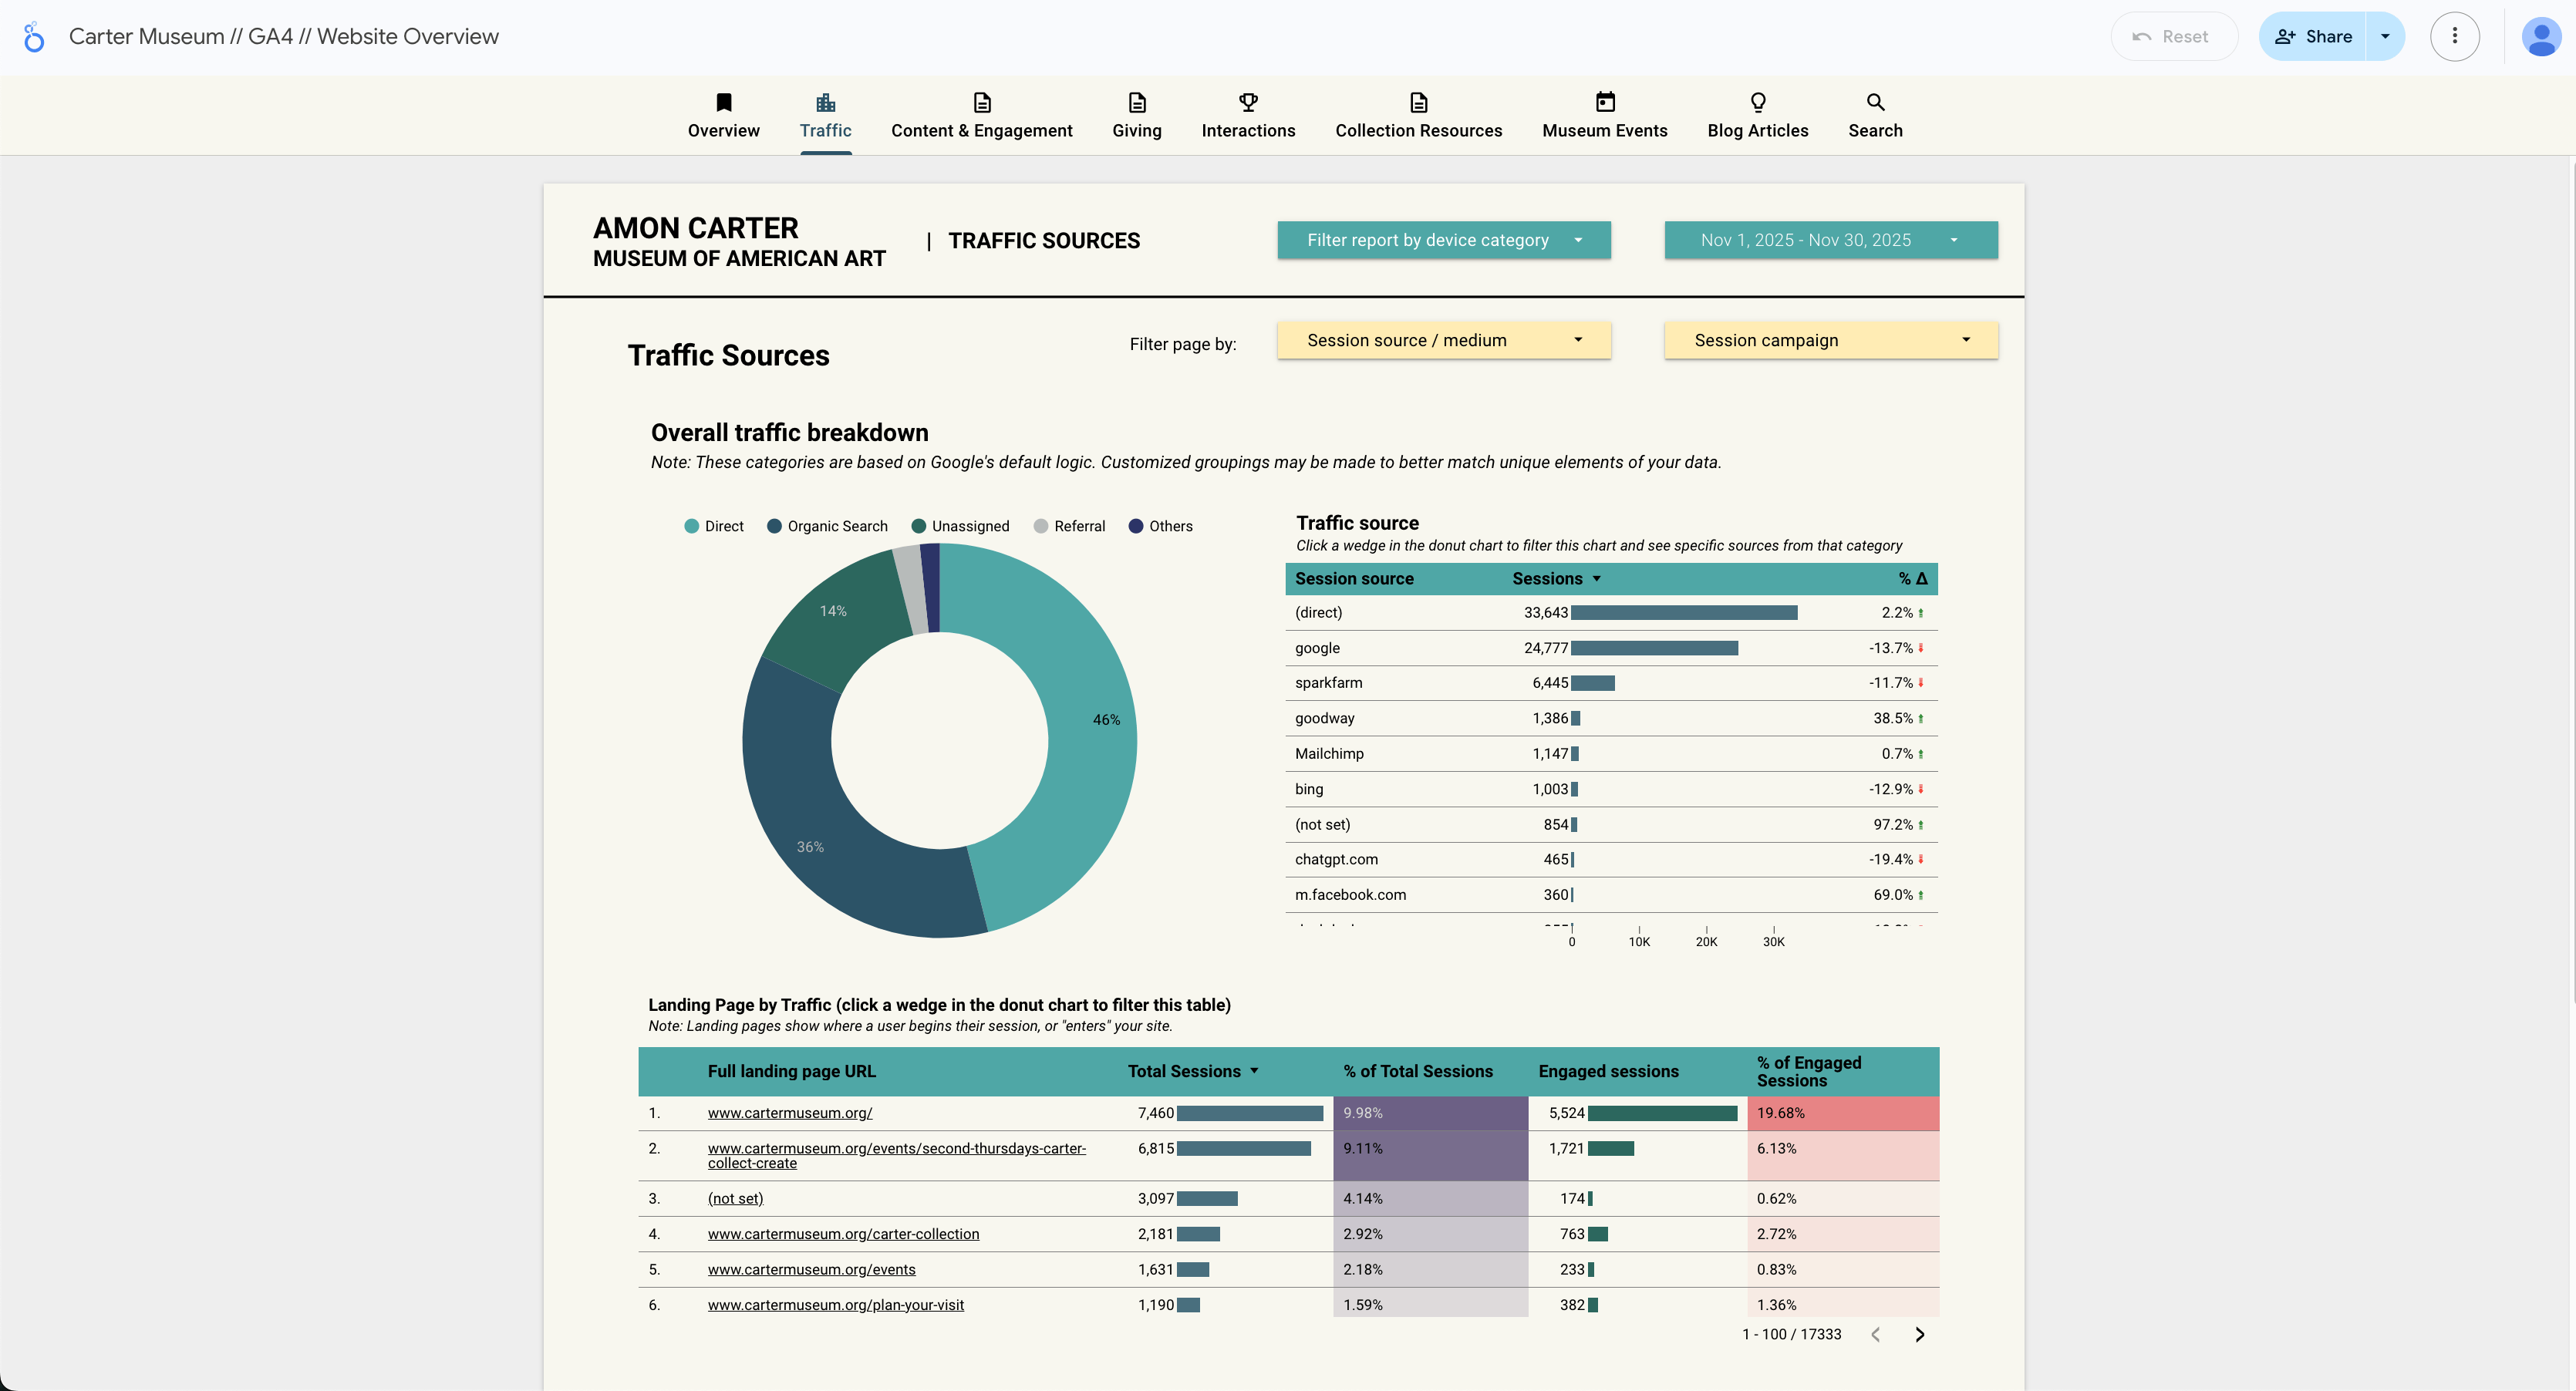
Event Pages Show High Traffic but Low Registration Conversion
Event pages receive 20,065 views (+10.6%) with 2,117 dwell and scrolls (users engaging deeply), but only 995 Eventbrite RSVP clicks represent just a 5% conversion rate. Users demonstrate interest but fail to convert due to poor CTA placement and UX friction.
Recommendation
Redesign the event page template to improve conversion by placing the primary registration CTA (“RSVP,” “Register,” or “Get Tickets”) prominently above the fold, ensuring it’s immediately visible when users land on the page. Add a persistent sticky CTA button that remains accessible as visitors scroll through event details. Follow this with heatmap and scroll-depth analysis to identify friction points in the layout, remove unnecessary barriers, and streamline the path from interest to registration.
Web Performance
site search quality
Search Functionality Shows Low Click-Through Rate
Site search shows 5,096 search result views, but only 1,969 result link clicks (38.6% CTR). Over 60% of searches end in no click, indicating poor search relevance or weak UI.
Recommendation
Audit and refine the site’s search experience by manually testing the top 20–30 queries to evaluate relevance and identify gaps in content indexing. Improve search result quality by tuning the algorithm, updating metadata on underperforming pages, and addressing content mismatches. Implement autocomplete suggestions, synonym handling, and filtering options (e.g., Artists, Collections, Events, Educator Resources) to guide users more effectively. These enhancements can increase search clarity, reduce zero-click searches, and raise the search result click-through rate toward a target of 60%+.
social Media Analysis
AUDIENCE
Instagram audience skews midlife and female, with limited reach to younger segments
The audience is heavily concentrated (56%) between the age of 35 to 54, with a roughly 2:1 female-to-male ratio.
To align with the market expansion strategy using reels, collaborations, and trend-aware formats to target younger audiences, especially for those under 35. Highlight student nights, young-professional events, and “things to do in Fort Worth”-style content.
To align with the market expansion strategy using reels, collaborations, and trend-aware formats to target younger audiences, especially for those under 35. Highlight student nights, young-professional events, and “things to do in Fort Worth”-style content.
social Media Analysis
CONTENT PERFORMANCE
Carousel Posts Outperform Static Images By 56% In Engagement, But Are Underutilized.
Carousel posts engagements outperform static images posts by 46%, despite representing only 14% of total posts.
Multi-image posts with deeper storytelling about artworks, exhibition details, and behind-the-scenes content strongly resonates with the audience.
Multi-image posts with deeper storytelling about artworks, exhibition details, and behind-the-scenes content strongly resonates with the audience.
social Media Analysis
CONTENT PERFORMANCE
interactive, Human-Centered Stories are top performers.
A typical story reaches around 200 accounts with a high completion rate (~93%), the best-performing story reaching 650 accounts and the lowest-reaching only 99.
Top performers are live, people-driven, and partner-amplified: dancer in motion, food trucks/waffle pops and ice cream carts, artist- or curator-led tours.
In Short: Action in the building + named partners + clear “happening now/don’t miss this” energy is what reliably pushes reach to the top tier.
Top performers are live, people-driven, and partner-amplified: dancer in motion, food trucks/waffle pops and ice cream carts, artist- or curator-led tours.
In Short: Action in the building + named partners + clear “happening now/don’t miss this” energy is what reliably pushes reach to the top tier.
social Media Analysis
REELS OPPORTUNITY
Massive Untapped Potential: Only 17 Reels In 365 Days, But They Average 1,774 Plays Each
Despite Reels being Instagram's highest-reach format (2025), the museum posted only 17 Reels over the past year. These Reels averaged 1,774 plays each with 4.5% engagement rate - exceeding engagement rate vs. posts. This represents the single biggest growth opportunity, as the highest reel played 4.8K times.
social Media Analysis
GEOGRAPHIC REACH
Strong Local Presence: 31% Of Audience From DFW Metro, Opportunity To Expand Regional Reach
Fort Worth represents 20.5% of the total audience (5,430 followers), with the broader DFW metro area comprising 31% (8,205 followers). This strong, local foundation is ideal for museum visitation conversion.
However, limited penetration in Dallas suburbs (Plano, Irving, Frisco) represents growth opportunity.
However, limited penetration in Dallas suburbs (Plano, Irving, Frisco) represents growth opportunity.
social Media Analysis
CONVERSION FUNNEL
Strong Engagement (Up to 12%) But Critically Weak Website Conversion - Only 220 Clicks From 2.6M Impressions
The museum demonstrates exceptional content capability with top posts achieving 10-12% engagement rates - well above the 3-6% museum industry benchmark. However, this engagement can be optimized for business outcomes: only 220 website clicks from 2.6M impressions (0.008% CTR) and minimal profile-to-website conversion despite 2,677 profile visits.
social Media Analysis
recommendation
Rich Content is key.
Shift from “flyer content” to save-worthy, story-driven content that drives reach, saves, and shares.
Quick, Human Moments
(High Impact) Include partnerships and curator talks as reoccurring anchors that co storytells the Carter experience.
Quick, human moments could be an artist sharing their favorite work on view, why a teacher likes being at the Carter. This type of content is informative while adding the opportunity for call-to-actions.
Carousel > Static Post
(QUICK WIN) Take the existing “flyer content” such as event announcements, exhibition reminders, and convert them into 2–5 frame carousels.
Frame 1 should sell the swipe, the middle frame delivers depth (ie. behind-the scenes, key facts, or short quotes), and the last frame should provide a recap so that the post is save-worthy.
build a Reel-based “Museum Stories” content Library
(LONG-TERM) Develop a long-term pipeline of rich short video contents such as:
(LONG-TERM) Develop a long-term pipeline of rich short video contents such as:
- Behind-the-scenes (BTS) moments
- Q&A series
- Exhibition walkthroughs
- Artists speaking about their work
- Community/education event moments
Dashboard
Repair Broken Charts
The "Collections Engagement" page displays "Looker Studio has encountered a system error" and "Chart configuration incomplete.
Reconnect the data source in Looker Studio for the "Pages by views" and "Call to action clicks" charts. Ensure the dimensions (e.g., Page URL) and metrics (e.g., Event Count) are valid fields in your GA4 property.
Reconnect the data source in Looker Studio for the "Pages by views" and "Call to action clicks" charts. Ensure the dimensions (e.g., Page URL) and metrics (e.g., Event Count) are valid fields in your GA4 property.
Dashboard
A bot Exclusion Filter
The data is heavily skewed by bot traffic. Page 1 shows "Lanzhou" and "Shanghai" as top cities with very low engagement. This deflates overall engagement metrics (like the 1m 32s average engagement time).
Create a filter in the Dashboard configuration to exclude traffic from
bot-heavy City = Lanzhou, Shanghai, Hangzhou, Guangzhou, Singapore, Ashburn. This will give a true picture of actual human behavior.
Create a filter in the Dashboard configuration to exclude traffic from
bot-heavy City = Lanzhou, Shanghai, Hangzhou, Guangzhou, Singapore, Ashburn. This will give a true picture of actual human behavior.
Dashboard
“unassigned” Traffic
"Unassigned" is the 3rd largest traffic source. In the breakdown, sparkfarm is listed as a source with (not set) medium, which GA4 cannot categorize.
Add a text box annotation next to the "Traffic Sources" chart explaining that "Unassigned" traffic is largely due to the sparkfarm campaign missing standard UTM parameters.
Add a text box annotation next to the "Traffic Sources" chart explaining that "Unassigned" traffic is largely due to the sparkfarm campaign missing standard UTM parameters.
Dashboard
solution
Problem space
The Amon Carter Museum generated significant digital engagement but broken analytics infrastructure prevented confident strategic decisions. Critical issues included: 20% unattributed traffic obscuring marketing ROI, 14% bot contamination inflating metrics and skewing benchmarks. Without clean data, the museum couldn't answer its core strategic question: how do we cultivate younger audiences (18-34) essential for long-term sustainability?
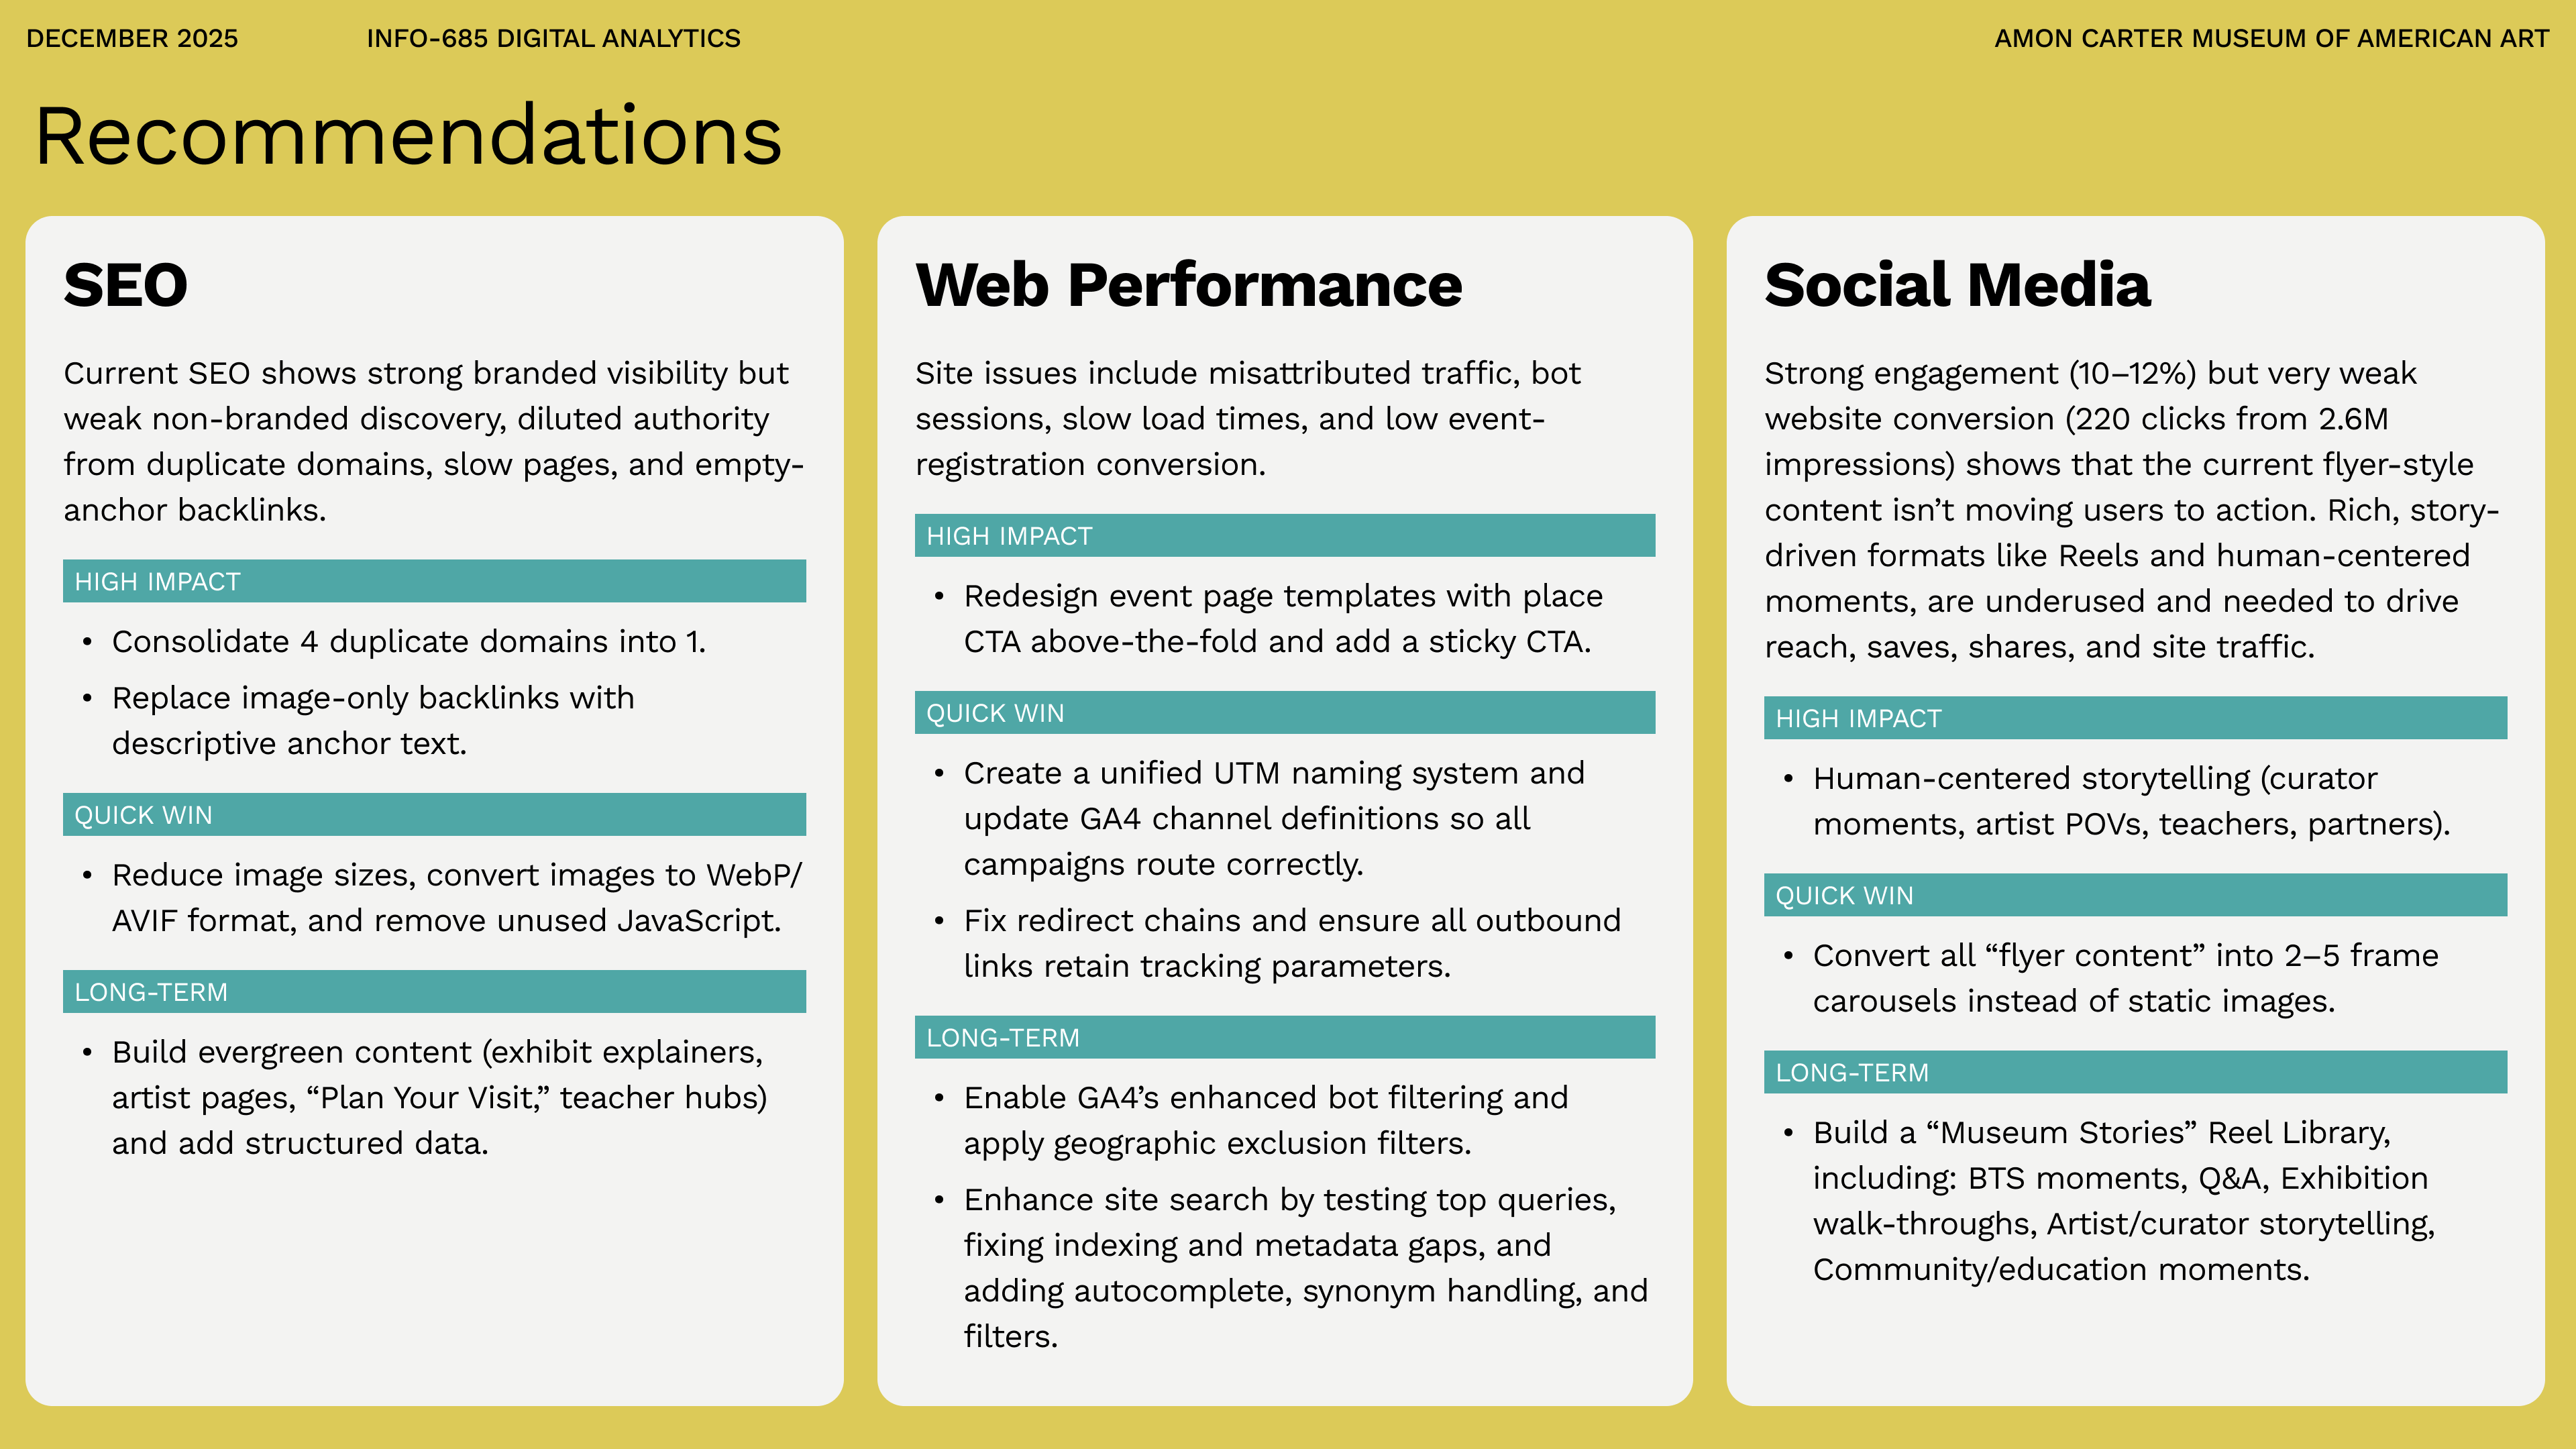
SEO
Current SEO shows strong branded visibility but weak non-branded discovery, diluted authority from duplicate domains, slow pages, and empty-anchor backlinks.
HIGH IMPACT
- Consolidate 4 duplicate domains into 1.
- Replace image-only backlinks with descriptive anchor text.
QUICK WIN
- Reduce image sizes, convert images to WebP/AVIF format, and remove unused JavaScript.
LONG-TERM
- Build evergreen content (exhibit explainers, artist pages, “Plan Your Visit,” teacher hubs) and add structured data.
Web Performance
Site issues include misattributed traffic, bot sessions, slow load times, and low event-registration conversion.
HIGH IMPACT
- Redesign event page templates with place CTA above-the-fold and add a sticky CTA.
QUICK WIN
- Create a unified UTM naming system and update GA4 channel definitions so all campaigns route correctly.
- Fix redirect chains and ensure all outbound links retain tracking parameters.
LONG-TERM
- Enable GA4’s enhanced bot filtering and apply geographic exclusion filters.
- Enhance site search by testing top queries, fixing indexing and metadata gaps, and adding autocomplete, synonym handling, and filters.
Social Media
Strong engagement (10–12%) but very weak website conversion (220 clicks from 2.6M impressions) shows that the current flyer-style content isn’t moving users to action. Rich, story-driven formats like Reels and human-centered moments, are underused and needed to drive reach, saves, shares, and site traffic.
HIGH IMPACT
- Human-centered storytelling (curator moments, artist POVs, teachers, partners).
QUICK WIN
- Convert all “flyer content” into 2–5 frame carousels instead of static images.
LONG-TERM
- Build a “Museum Stories” Reel Library, including: BTS moments, Q&A, Exhibition walk-throughs, Artist/curator storytelling, Community/education moments.
Reflection
What This Project Taught Me?
Attribution is infrastructure, not analysis.
I thought attribution was about understanding where traffic came from. This project taught me it's about building systems that make attribution possible—standardized UTM parameters, documentation, team training, testing redirect chains. The 20% attribution gap wasn't a GA4 failure; it was an organizational process failure that required a framework, not just an analysis.
All data is dirty until proven clean.
I discovered the bot traffic because I questioned why Lanzhou ranked 3rd for a Texas museum. That curiosity revealed 14% of sessions were automated, distorting every metric. Now I know to ask "does this pattern make sense?" before asking "what does this pattern mean?" Healthy skepticism became my most important analytics skill.
Context transforms numbers into strategy.
The demographic finding wasn't just a correction—it reframed the entire challenge from "maintain young audiences" to "build them from scratch," changing resource allocation and content strategy.
What Surprised Me Most
I expected a museum with 67K monthly users to have clean analytics. Instead, I found 20% attribution gaps, 14% bot contamination, broken dashboards, and no UTM standards. This taught me that data quality isn't a given—it's a practice. Even sophisticated organizations struggle with the basics, which means there's massive opportunity for someone who can help them move from "we have data" to "we have clean, actionable data."
What This Means for Me
This project crystallized my interest in analytics translation—the space between technical analysis and strategic decision-making. I'm energized by uncovering patterns (detective work), connecting them to outcomes (the "so what?"), and building systems for non-technical users. Less interested in pure technical implementation or reporting without interpretation. This points me toward roles like Digital Analytics Consultant or Data-Informed UX Researcher where I can bridge technical depth and strategic impact.