EV Market Evolution Analysis (2010-2023)
Oct 26, 2024
BY James Huang
Navigating Technological Transitions: Lessons from Global EV Adoption for the Autonomous Vehicle Future
BY James Huang
1. Introduction
The global transition to electric vehicles has created a natural experiment in how societies adopt transformative technologies. This study analyzes EV sales share data across 34 countries from 2010 to 2023, examining how markets progress from initial adoption to mainstream acceptance. Through multiple visualization approaches, I investigate regional disparities, policy effectiveness, and market development patterns, seeking insights that could inform the future integration of autonomous vehicles in the global automotive landscape.
Data Analyst,
Researcher
Researcher
Oct 5-26, 2024
(3 weeks)
(3 weeks)
Tableau, RStudio, Google Sheet, Claude, Figma
2. Project Background
As an enthusiast in autonomous vehicle technology, I think there must be some parallels between today's self-driving car development and the electric vehicle revolution of the past decade. Both represent transformative technologies that challenge traditional automotive paradigms, requiring not just technological advancement but fundamental shifts in consumer behavior, infrastructure, and policy frameworks. I think the EV market's evolution from hesitant acceptance to mainstream adoption in certain regions offers crucial insights for autonomous vehicles' future trajectory.
By analyzing EV sales share data across 34 countries from 2010 to 2023, I aim to understand the factors driving technological acceptance. The dramatic variations in adoption rates - from Norway's remarkable 93% to emerging markets below 5% - reveal how policy support, market readiness, and regional cooperation influence breakthrough technologies. As we stand at the dawn of autonomous driving, I believe these lessons from the EV revolution become increasingly valuable, potentially helping us navigate the complex path from innovation to widespread adoption.
By analyzing EV sales share data across 34 countries from 2010 to 2023, I aim to understand the factors driving technological acceptance. The dramatic variations in adoption rates - from Norway's remarkable 93% to emerging markets below 5% - reveal how policy support, market readiness, and regional cooperation influence breakthrough technologies. As we stand at the dawn of autonomous driving, I believe these lessons from the EV revolution become increasingly valuable, potentially helping us navigate the complex path from innovation to widespread adoption.
3. Problem Space
- How have global EV adoption patterns evolved since 2010, and what key factors explain the stark contrast between Nordic success (45-93% adoption) and other markets' limited progress?
- To what extent do initial market positions determine long-term EV adoption success? What explains the dramatic divergence between markets starting at similar levels but achieving vastly different 2023 outcomes?
- What critical thresholds exist in EV market development, as evidenced by distinct clustering patterns (70%+, 45-70%, 30-45%, <30%)? Why have so few markets achieved status of 70%+ adoption rate?
- How do regional policy frameworks influence adoption trajectories, particularly in explaining the Nordic region's success paths versus other regions' more limited progress?
- What insights can be drawn from the post-2020 market acceleration period, and what implications do these patterns have for markets still in early adoption phases (<10%)?
4. Material (software and datasets used)
Dataset:
The data for historical and projected data on electric vehicles sales, stock, charging infrastructure and oil displacement from 2010 to 2023 includes:
The data for historical and projected data on electric vehicles sales, stock, charging infrastructure and oil displacement from 2010 to 2023 includes:
- IEA Global EV Data 2024
- The 34 countries were selected based on their representation of major global EV markets and data reliability, ensuring comprehensive coverage across six regions. This selection enables robust regional pattern identification while maintaining data quality, as these markets provide complete and consistent sales share records throughout the study period of 2010-2023.
- Regional Distribution:
- Europe (19): Austria, Belgium, Bulgaria, Denmark, Finland, France, Germany, Greece, Iceland, Ireland, Italy, Netherlands, Norway, Poland, Portugal, Romania, Sweden, Switzerland, United Kingdom
- Asia (5): China, India, Israel, Japan, South Korea
- North America (3): Canada, Mexico, USA
- South America (3): Brazil, Chile, Colombia
- Oceania (2): Australia, New Zealand
- Africa (2): Seychelles, South Africa
- Data organization and analysis: Google Sheet, RStudio
- Data visualization: Tableau
5. Methods / Process / Rationale
 EV car sales share from 2010 to 2023
Line Chart for Regional EV Sales Share Trends (2010-2023):
EV car sales share from 2010 to 2023
Line Chart for Regional EV Sales Share Trends (2010-2023):
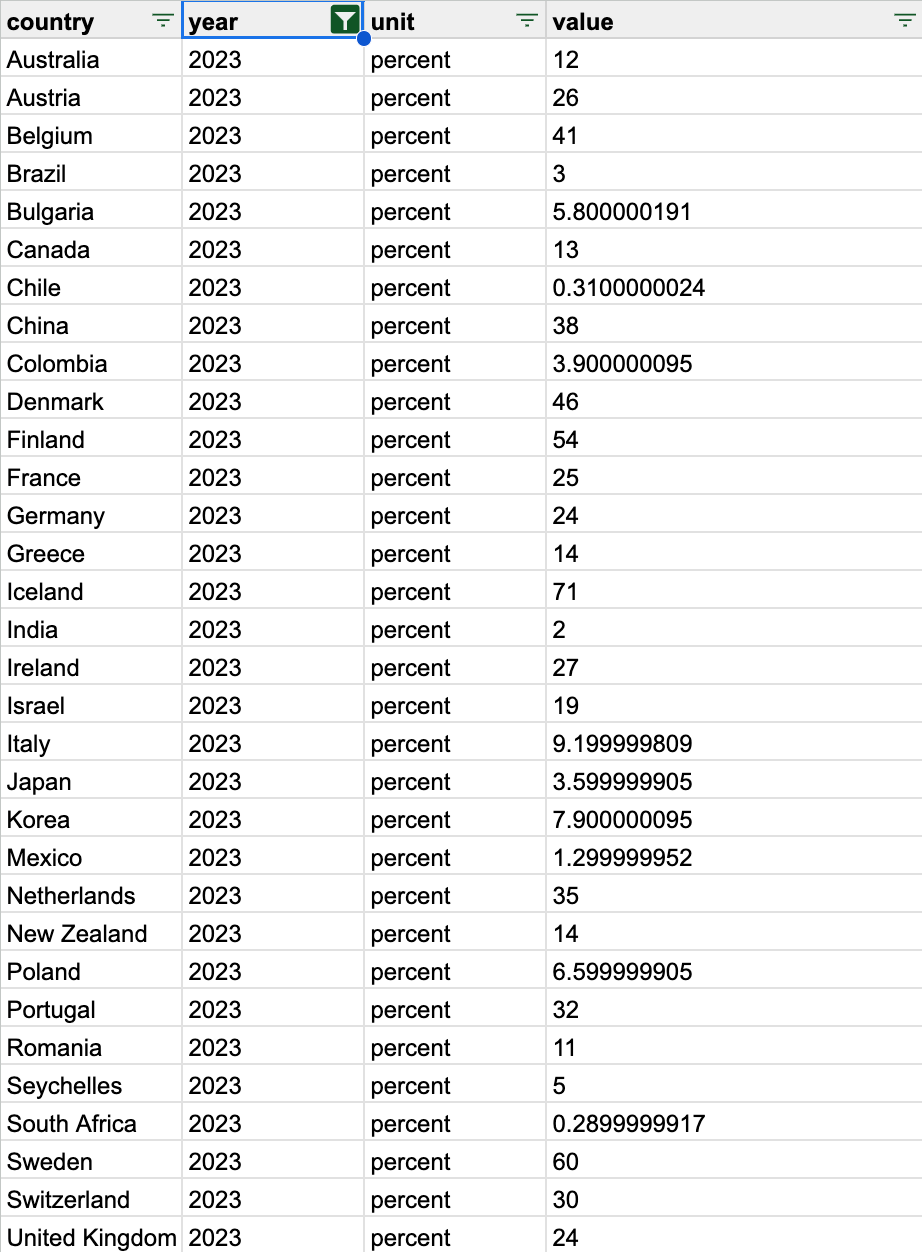
Data Filtering & Selection:
- Filter IEA Global EV Data 2024, parameter including:
- EV sales share
- Mode: Cars
- Powertrain: EV
- Year: 2010-2023
- Select and group 34 countries into 6 regions
- Export data (country, year, value)
- https://docs.google.com/spreadsheets/d/16t3QXWbnnda9SyzB6M6LIlBXTZqqQMJenkvH0sXgPwU/edit?gid=0#gid=0
- Import data into Tableau and create calculated field for percentage display
- Create "Region Group" calculated field for regional categorization
- Create line chart:
- Drag "Year" to Columns and set to continuous
- Drag "EV Adoption Rate" to Rows and set to Average
- Drag "Region Group" to Color
- Implement year filter for 2010-2023 range
- Add reference line for global average
- Format axis to show percentage properly
- Add title and legend
- Import data into Tableau and create calculated field for percentage display
- Create Tree Map:
- Drag "Country" to filter and exclude Mexico
- Drag “Region”, “Year”, “EV Adoption Rate” to Label
- Drag "EV Adoption Rate" to Size and Color
- Implement year filter for 2010-2023 range
- Set EV Adoption Rate to Average
- Set color scheme
- Format labels and tooltips
- Add title and legend
- Import data into Tableau and create calculated field
- Create heat map:
- Drag “Country” and “Region Group” to Rows
- Drag “Year” to Columns and implement year filter for 2010-2023 range
- Apply “EV Adoption Rate” to color
- Adjust blue color gradient for clear data visualization
- Add country labels and tooltips, and ensure label readability
- Format percentage displays
- Add title and legend
- Import data into Tableau
- Create calculated field for earliest value (using CASE statement for different start years)
- Create 2023 value field
- Create Scatter Plot:
- Plot earliest value vs 2023 value
- Set logarithmic scale
- Add Region Group to color and shape
- Add reference lines for averages
- Add labels and tooltips
- Format axes as percentages
- Add title and legends
6. Results / Interpretation
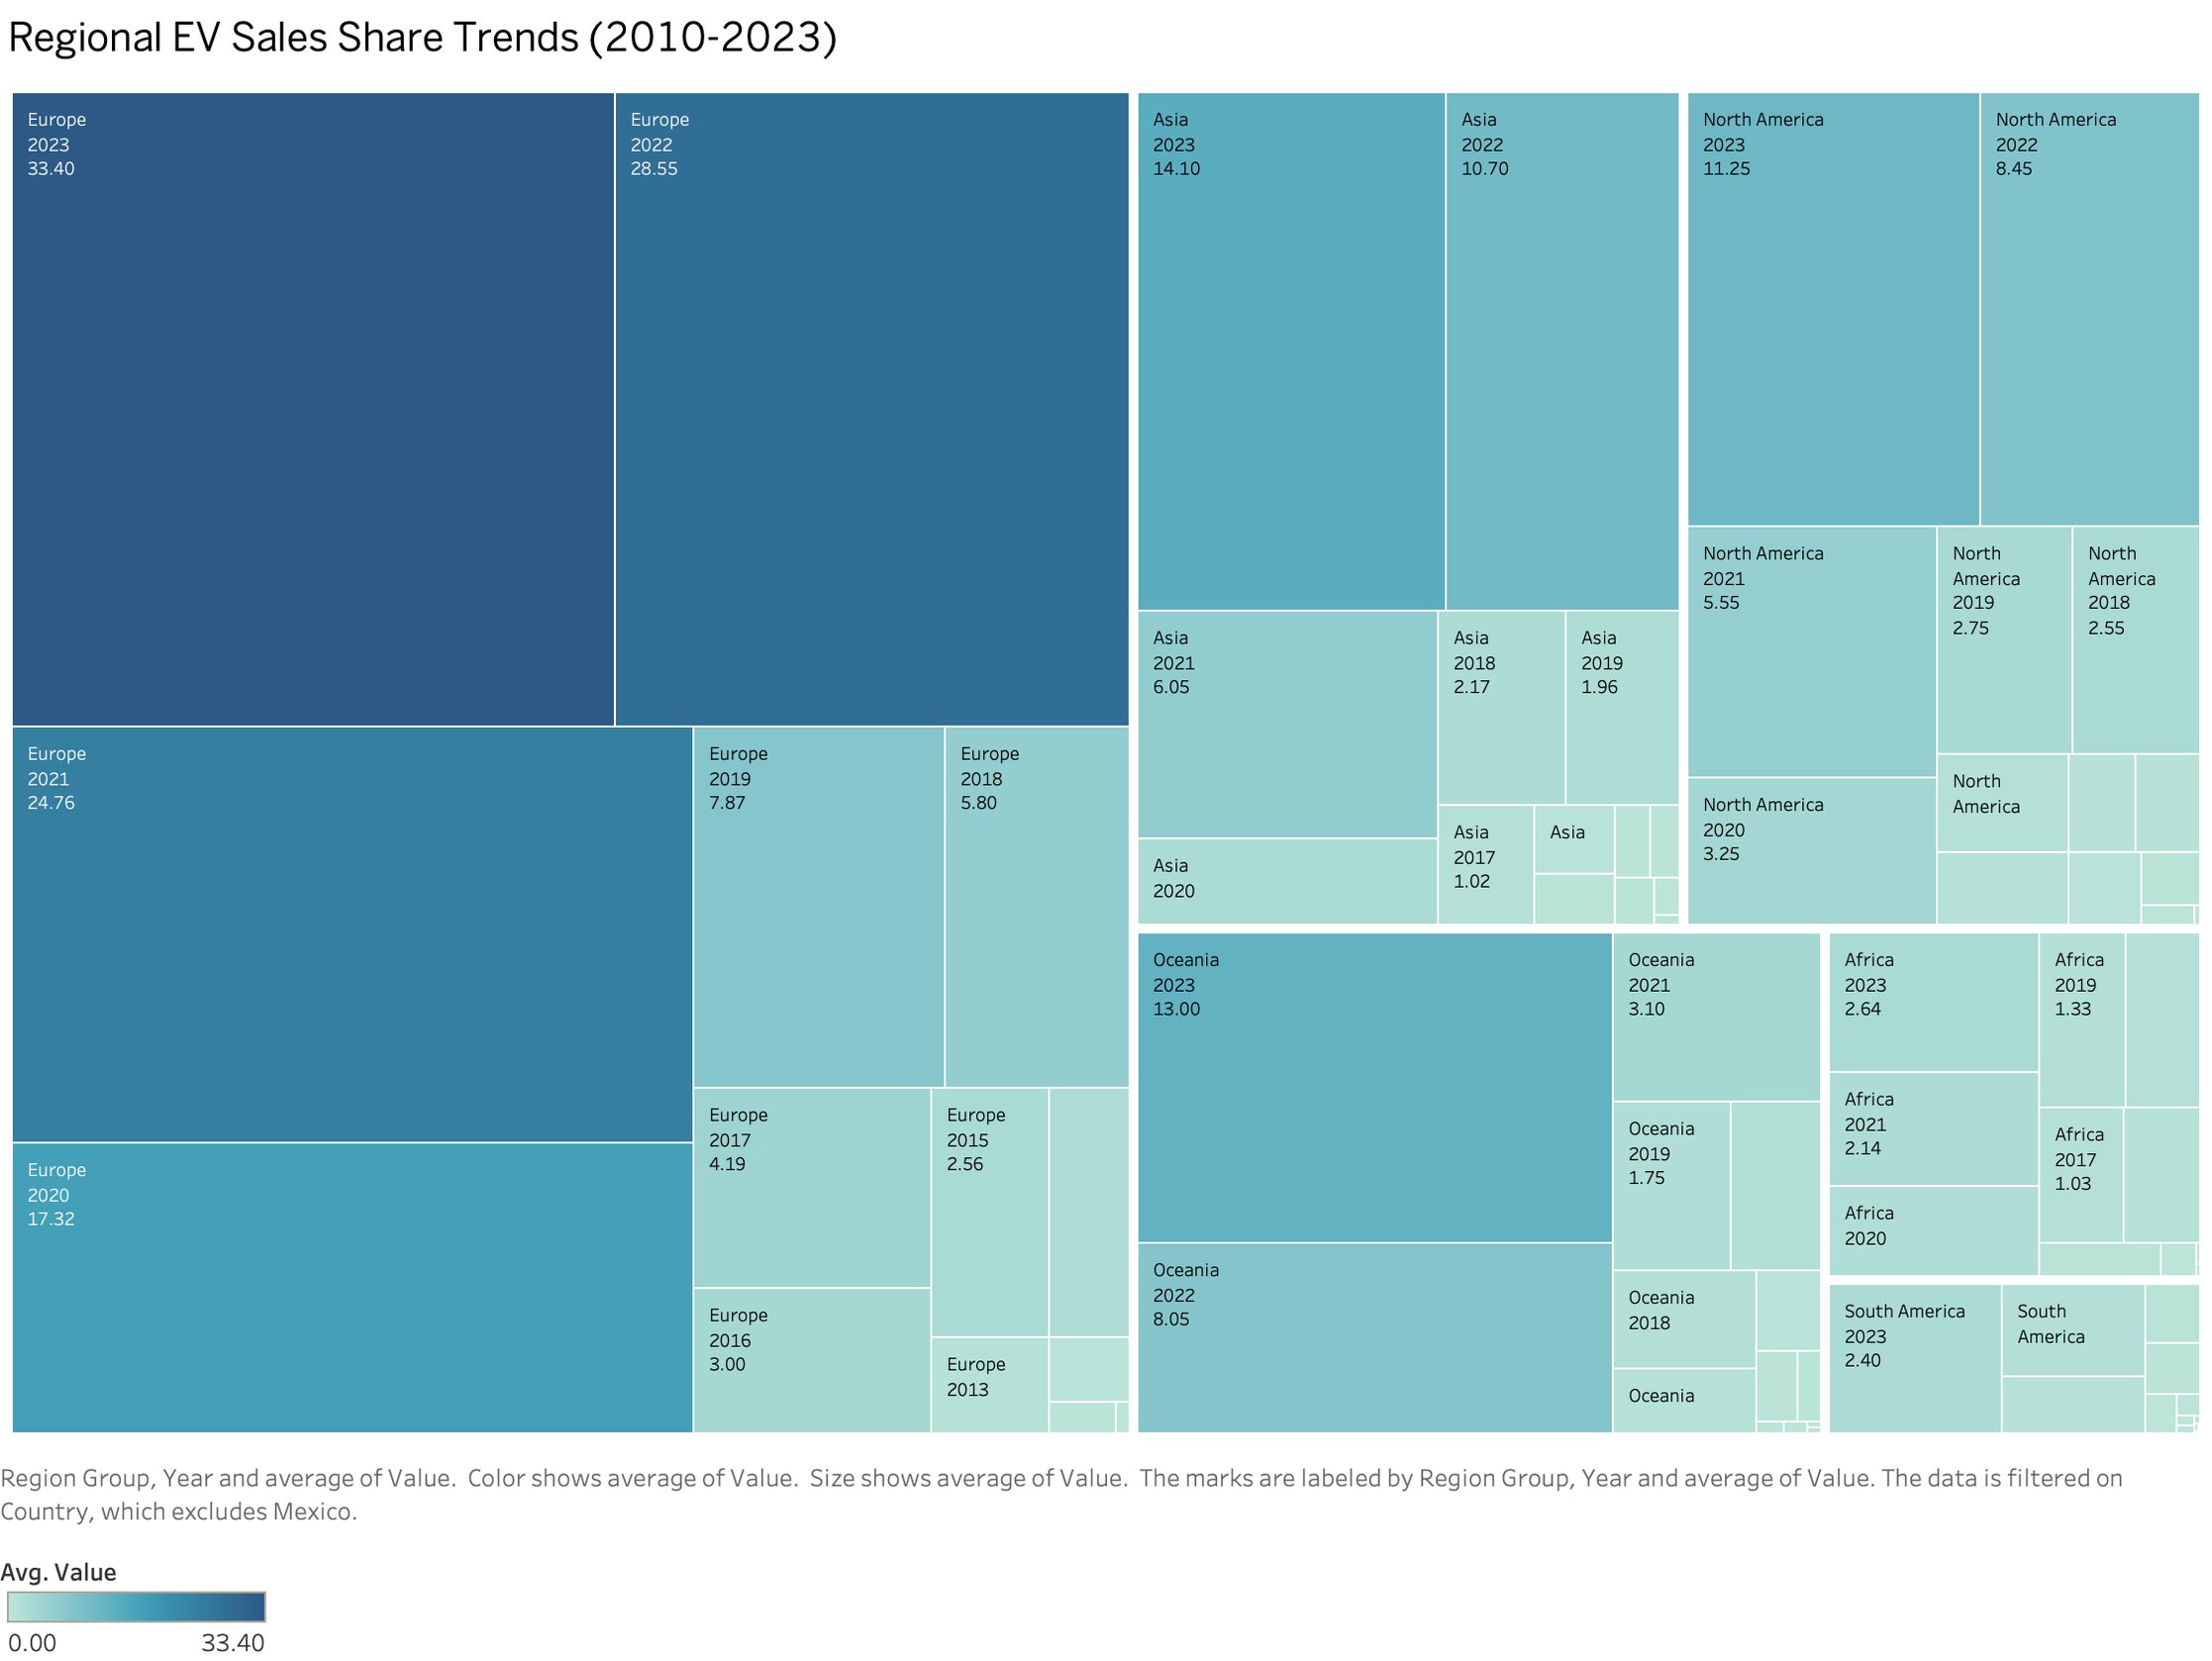
 The Tree Map complements by showing:
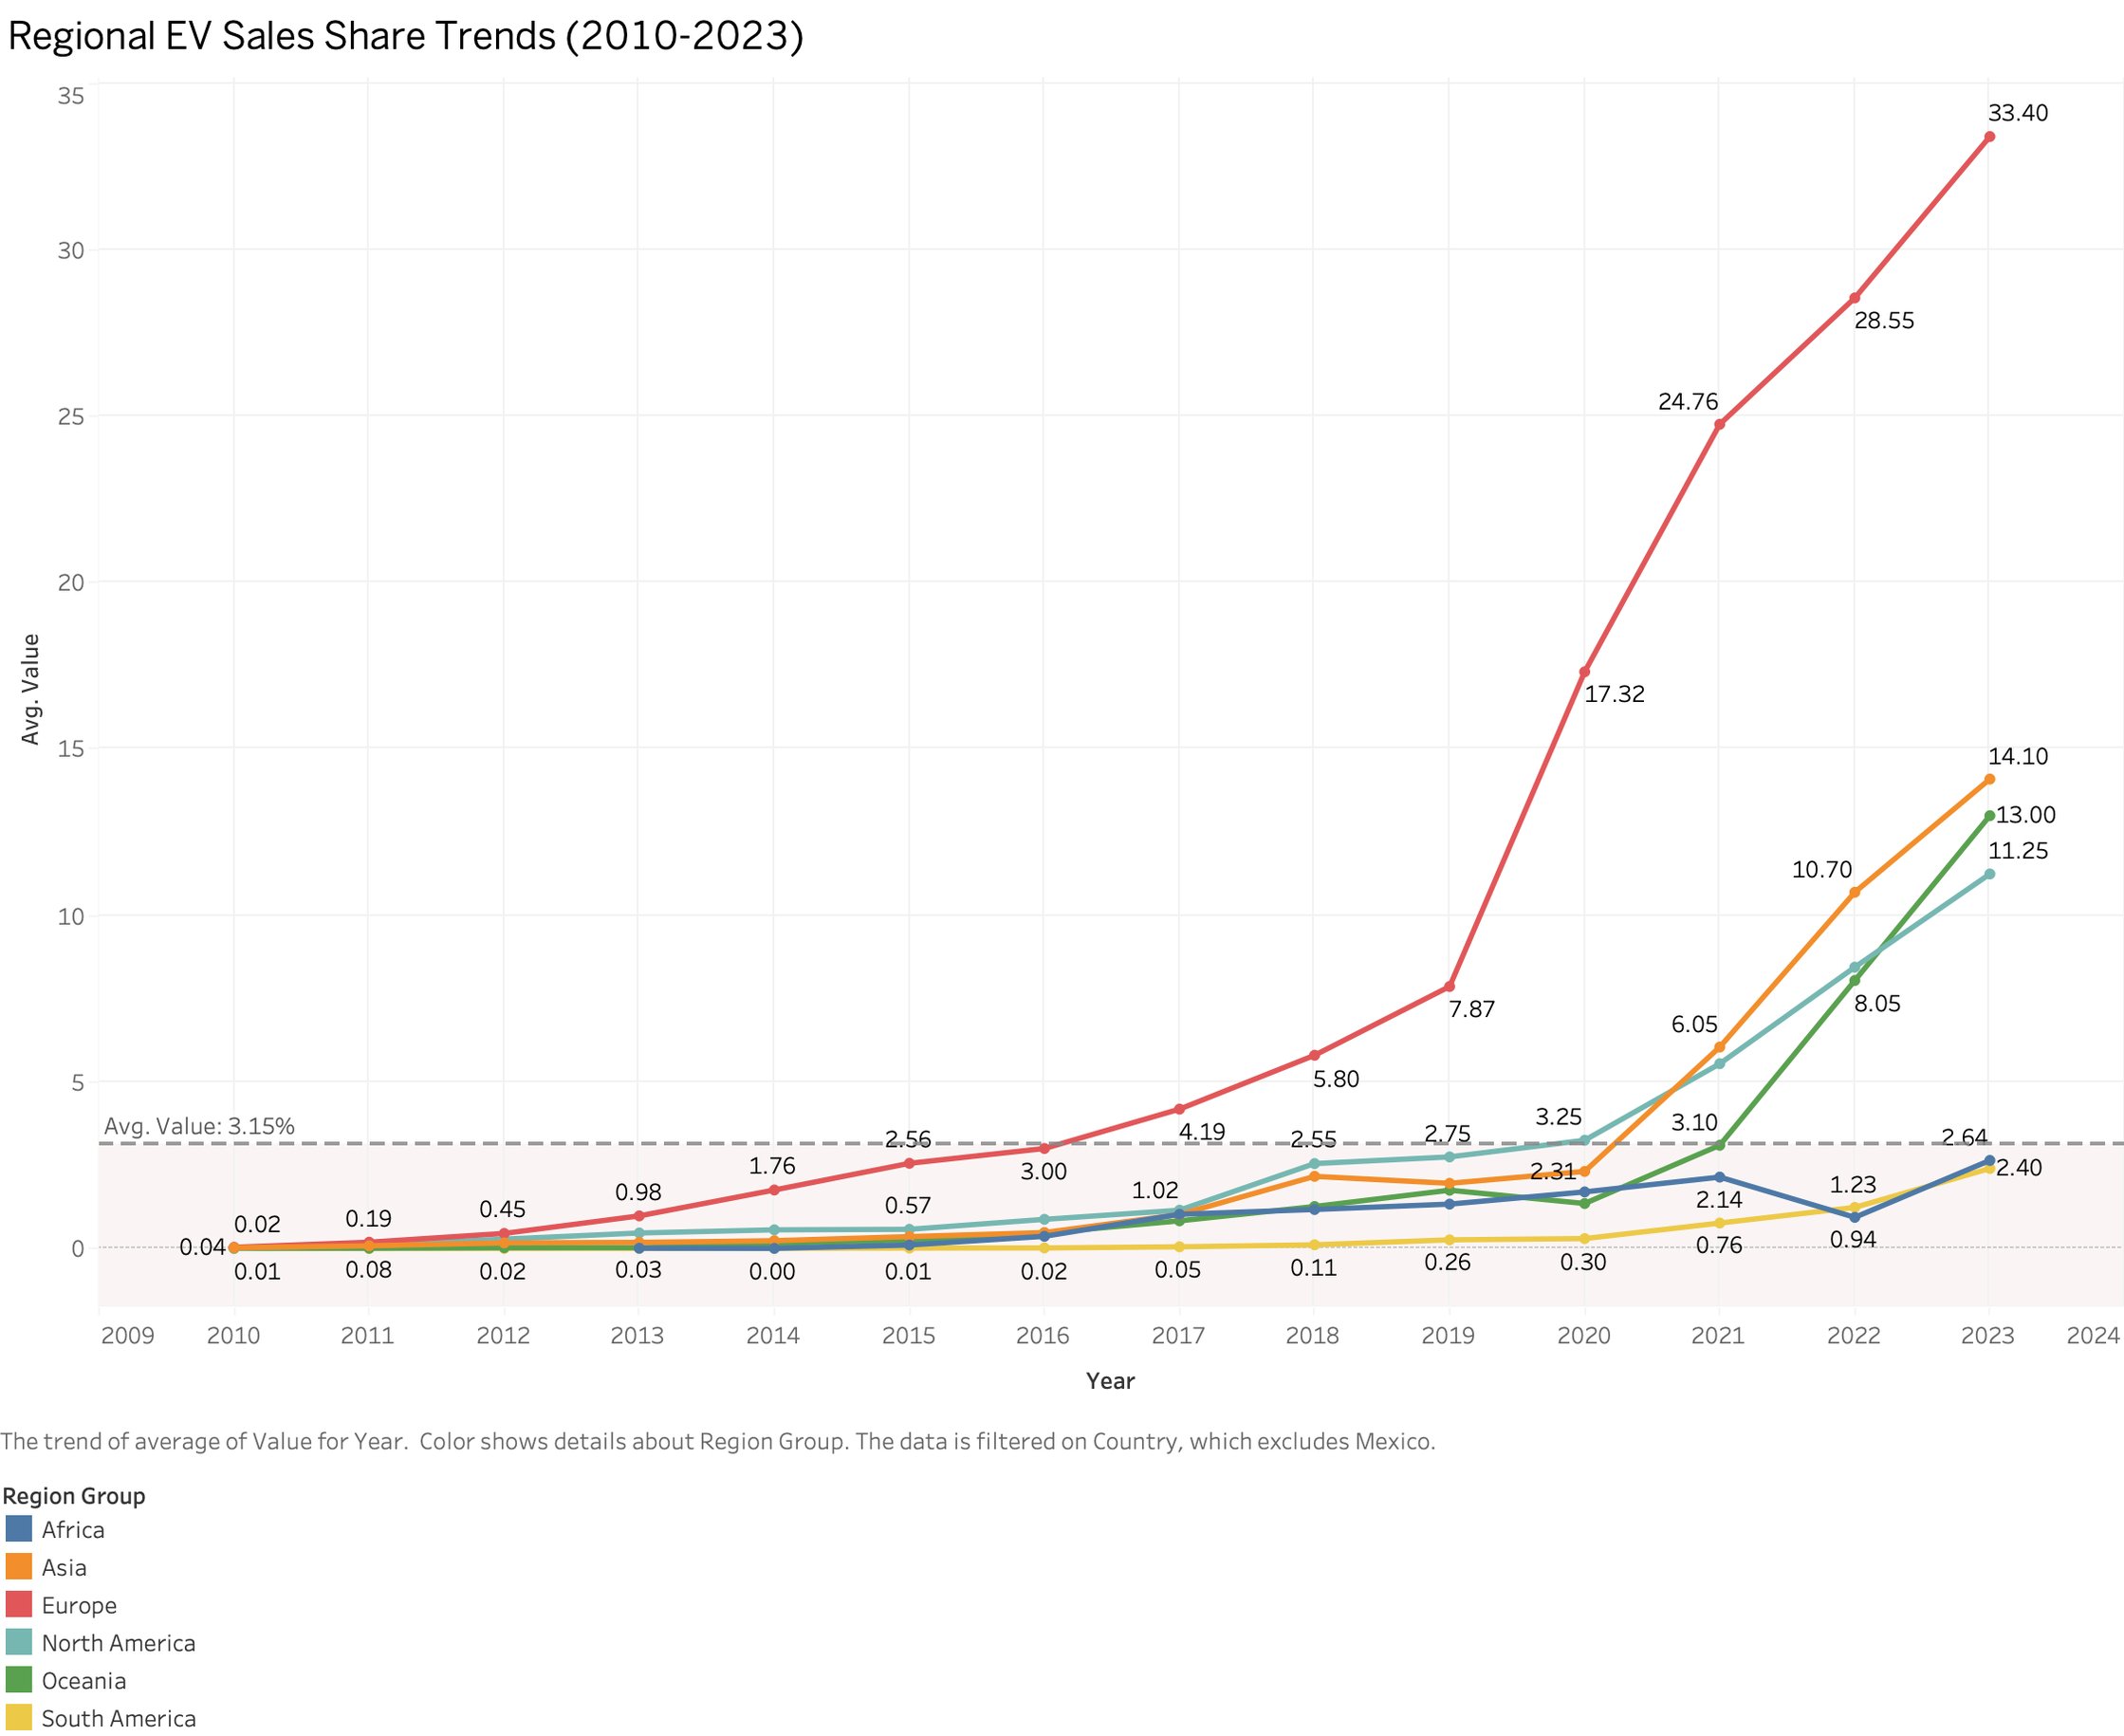
Visualization 1 - Regional EV Sales Share Trends (2010-2023)
- Line Chart (Temporal trends and regional comparisons)
- Tree Map (Hierarchical market structure)
- Time progression (x-axis) from 2010 to 2023
- EV sales share percentage (y-axis) ranging from 0% to 35%
- Six regions represented by distinct colored lines
- Global average reference line (3.15%) shown as dotted gray line
- Size hierarchy of regional performance
- Color intensity indicating adoption levels
- Temporal progression through block sizing
- Recent years (2021-2023): Larger blocks showing market growth
- Earlier years: Smaller blocks reflecting initial market development
- Regional grouping showing market evolution
- Europe dominating upper section with largest blocks
- Asia, Oceania and North America(excluding Mexico) showing medium-sized blocks
Key Observations / Insights:
- Regional Leadership and Evolution (2010-2023)
- European Market
- Observation:
The region demonstrates exceptional growth from a modest 0.04% in 2010 to a commanding 33.40% in 2023, with a particularly dramatic acceleration after 2020. This leadership is strikingly visible in the steep upward trend line, with the treemap's dark blue blocks visually emphasizing this dominance in recent years(2021-2023). - Gradual Growth (2010-2019): 0.04% to 7.87%
- Initial Acceleration (2020): Jumping to 17.32%
- Rapid Expansion (2021-2023): Surging from 24.76% to 33.40%
- Interpretation:
- Early adoption and consistent policy support likely enabled Europe's sustained leadership.
- The 2020 acceleration suggests a critical market tipping point, possibly driven by improved technology, increased consumer acceptance, and strengthened policy measures.
- The consistent growth indicates a maturing market with established infrastructure and consumer confidence.
- Emergence of Second-Tier Markets
- Observation:
The exclusion of Mexico reveals a strikingly cohesive second-tier group, with three regions showing remarkably similar trajectories and final outcomes: - Asia: Steady climb to 14.10% by 2023, with notable acceleration from 6.05% in 2021.
- Oceania: Reaching 13.00% by 2023, up from 3.10% in 2021.
- North America (excluding Mexico): Achieving 11.25% by 2023, progressing from 5.55% in 2021.
- Interpretation:
- The convergence suggests similar market development conditions across developed economies. Their parallel development is particularly evident in the line chart's overlapping patterns and similarly sized blocks in the treemap.
- Excluding Mexico reveals a more accurate picture of EV adoption in developed North American markets.
- The parallel growth patterns might indicate shared market maturity levels and similar policy approaches.
- Market Evolution Dynamics
- Pre-2020 Market Foundation
- Observation:
- Europe establishing early lead (reaching 7.87% by 2019).
- Second-tier markets maintaining steady but modest growth (2-3% range).
- Global average hovering around 3.15%, indicating limited market penetration.
- Interpretation:
- Initial slow growth reflects typical early-stage market challenges.
- The consistent gap between Europe and others suggests effective early policy implementation.
- Low global average indicates EV adoption was still a niche market phenomenon.
- Post-2020 Acceleration
- Observation:
- Europe almost more than doubles: 17.32% (2020) to 33.40% (2023).
- Second-tier markets show synchronized acceleration:
- Asia: 2.31% to 14.10% (6.1x increase)
- Oceania: 3.10% to 13.00% (4.2x increase)
- North America: 3.25% to 11.25% (3.5x increase)
- Interpretation:
- 2020 marks a global turning point in EV adoption.
- Accelerated growth suggests overcoming key barriers like cost, range, and infrastructure.
- Similar growth patterns in second-tier markets indicate shared market maturity characteristics.
- Future Implications
- Observation:
- Global average of 3.15% indicates still-early stage of overall market development, despite leaders' success.
- Three-tier market hierarchy structure by 2023, clearly illustrated by the treemap through block sizes and color intensity:
Leadership Tier: Europe (33.40%)
Established Markets: Second-tier cluster (11-14%)
Developing Markets: Africa (2.64%) and South America (2.40%) - Interpretation:
- The market structure and growth trajectories suggest different stages of EV ecosystem development.
- Second-tier convergence indicates a potential ceiling for current technology and policy frameworks.
- Post-2020 surge shows developed markets reaching critical adoption thresholds.
- Developing markets may need different approaches to overcome unique challenges.
- Emerging markets' lag indicates need for continued policy support and infrastructure development.
Visualization 2 - Global EV Sales Share by Country (2010-2023)
- Heat Map (Detailed country-level progression)
- Countries (rows) grouped by regions
- Years (columns) from 2010 to 2023
- Adoption rates shown through color intensity (darker blue = higher adoption)
- Values ranging from 0% to 93% (Norway, 2023)
Key Observations / Insights:
- Regional Leadership
- European Market - Clear Dominance
- Observation:
- Nordic countries lead global adoption.
- Norway:
- Exceptional growth from 0.28% (2010) to 93% (2023)
- First to pass 50% milestone (56% in 2019)
- Achieved near-complete market transition at 93% (2023)
- Strong Nordic Cluster:
- Iceland: From no data in 2010 to 71% in 2023
- Sweden: 0.09% (2010) to 60% (2023)
- Finland: 0.03% (2010) to 54% (2023)
- Denmark: 0.25% (2010) to 46% (2023)
- The region shows distinct adoption tiers, from Nordic leaders (46-93%) to strong Central European performance (24-41% in Germany, Belgium) and developing Southern European markets (9-32% in Italy, Portugal).
- Interpretation:
- There appears to be a strong correlation between comprehensive policies and adoption rates, particularly evident in Nordic countries where supportive measures led to exceptional growth (Norway: 0.28% to 93% over 13 years).
- A remarkable Nordic cluster has emerged, albeit with a 5-7 year lag, suggesting a regional pattern of success.
- The influence of EU environmental regulations seems to drive consistent regional growth, as demonstrated by Central European countries achieving 24-41% adoption rates.
- Asian Market Development - Varied Growth
- Observation:
- China's Transformation:
- Early Phase: Minimal adoption 0.01% (2010)
- Growth Phase: 0.40% (2014) to 5% (2019)
- Acceleration: Dramatic jump from 5.7% (2020) to 38% (2023)
- Other Asian Markets:
- Advanced Adoption: Israel (19% by 2023)
- Moderate Progress: Korea (7.9% by 2023), Japan (3.6% by 2023)
- Emerging Market: India (2% by 2023)
- Interpretation:
- China's policy framework likely enabled its remarkable transformation, showing a dramatic increase from 5.7% to 38% in just three years (2020-2023), demonstrates potential for accelerated adoption in large markets with the right conditions.
- A stark 36 percentage point gap between China (38%) and India (2%) highlights significant regional disparities.
- Global Market Evolution
- Observation:
- Early Market Development (2010-2015)
- Limited adoption globally (<1% in most markets).
- Norway established early lead: 0.28% to 22%.
- Netherlands: Early adopter reaching 9.5%.
- Development Period (2016-2020)
- Norway crossed 50% milestone.
- Other Nordic countries beginning acceleration
- Iceland accelerated from 6.3% to 52%.
- Finland surged from 1.2% to 18%.
- Most markets are still under 15%.
- Acceleration Adoption (2021-2023)
- 15 countries exceeded 20% adoption.
- China more than doubled adoption from 16% to 38%.
- Traditional markets (USA, Japan) showed modest growth (USA: 9.5%, Japan: 3.6%).
- Interpretation:
- Clear three-phase pattern emerges across markets:
Initial slow growth (0-5%), Acceleration (5-20%), Rapid adoption (>20%). It suggests a predictable market development trajectory with policy support and infrastructure development as key enablers, though timing varies by region. - Future Implications
- Observation:
- Early adopters maintain 5-7 year advantages, with consistent growth patterns:
- Leaders (>30%) show steady acceleration.
- Followers (10-30%) demonstrate compressed growth timelines.
- Emerging markets (<10%) remain under 5%.
- Interpretation:
- There appears to be a widening divide between market segments.
- European leadership looks set to continue.
- Catch-up potential seems evident: China's trajectory (5.7% to 38% in 3 years) suggests possibility.
- Market development follows predictable patterns, with early adopters' experiences providing roadmaps for following markets.
- Infrastructure limitations and insufficient policy support may help explain why most emerging markets remain below 5% while developed markets exceed 20% by 2023.
Visualization 3 - EV Adoption Trajectories: Initial Position vs Current Status (2010-2023)
- Scatter Plot (Growth trajectories and market positioning)
- X-axis: Average Earliest Adoption Year Value (log scale)
- Y-axis: Average 2023 Adoption Rate (linear scale)
- Each point represents a country
- Point colors and shapes indicate different regions
- Average 2023 adoption rate across countries is 22.57%
Key Observations / Insights:
- Quadrant Distribution
- Observation:
The quadrants created by average lines (2023: 22.57%, Initial: 0.0657%) reveal distinct market groupings: - Upper Right (High Early/High Current):
Norway (started at 0.28% → 93%), Iceland (started at 0.33% → 71%), showing high adoption rate from relatively higher starting points. - Upper Left (Low start/High current):
Largest successful group, including Nordic leaders (Sweden 0.09% → 60%, Finland 0.03% → 54%), major economies (China 0.01% → 38%, Germany 0.00% → 24%), showing strong growth from low start. - Lower Left (Low start/Low current):
Most populous quadrant containing majority of markets (India 0.02% → 2%, Japan 0.05% → 3.6%, Brazil 0.00% → 3%) - Lower Right(High start/Low current):
Small group of markets with above-average start but below-average current rates (Bulgaria 0.09% → 5.8%, Seychelles 0.15% → 5.0%) - Interpretation:
- Early high adoption shows mixed results - While starting position shows some correlation with final achievement (as seen in Norway and Iceland's leadership), Bulgaria and Seychelles demonstrate that higher initial adoption doesn't guarantee sustained success. Most successful markets actually started from lower bases.
- Regional Development Patterns
- Observation:
- Nordic Region: Two successful paths:
- High start/High achievement (Norway 93%, Iceland 71%)
- Low start/High achievement (Sweden 60%, Finland 54%)
- Continental Europe: Consistent growth (Belgium 41%, Netherlands 35%)
- Asia: Wide disparity (China 38% vs India 2%)
- Oceania: Mid-range cluster (Australia 12%, New Zealand 14%)
- Interpretation:
- Regional policy frameworks strongly influence adoption trajectories, with Nordic and European frameworks proving most effective at driving growth regardless of starting position.
- Growth Speed and Transformation
- Observation:
- Fast-growing markets from low base:
- Belgium: 0.01% → 41%
- Portugal: 0.01% → 32%
- Germany, France, UK: ~0.01% → ~24-25%
- Similar starts, different outcomes:
- High achievers: Finland (0.03% → 54%)
- Mid-range: Germany (0.00% → 24%)
- Low range: Japan (0.05% → 3.6%)
- Interpretation:
- Rapid transformation is possible regardless of starting point, but requires effective policy implementation and market development strategies. Similar starting positions can lead to vastly different outcomes based on policy effectiveness.
- Non-Linear Distribution Patterns
- Observation:
- Distinct Value Groupings in 2023:
- Top Tier (>70%): Isolated cluster with only two countries (Norway 93%, Iceland 71%)
- Upper-Middle (45-60%): Dense cluster of Nordic countries (Sweden 60%, Finland 54%, Denmark 46%)
- Lower-Middle (30-45%): Group including Belgium 41%, China 38%, Netherlands 35%
- Mid-Range (10-30%): Significant cluster including Israel 19%, Greece 14%, New Zealand 14%, Australia 12%
- Base Level (<10%): Heavy concentration of countries (Japan 3.6%, India 2%, Brazil 3%)
- Distribution of Initial Values:
- Most countries started between 0.01-0.05%
- Only a few countries (Norway, Iceland) started above 0.1%
- Interpretation:
- The distribution shows clear market development stages with distinct clustering at certain levels.
- The gap between top performers (>70%) and others suggests a significant threshold for achieving elite status.
- Mid-range markets (10-30%) form a substantial group, indicating this might be an achievable target for developing markets.
7. Discussion for Problem Space
- Evolution of Global EV Adoption Patterns
The visualizations reveal diverse global EV adoption trajectories, with outcomes ranging from 2% to 93%. The line chart and heat map highlight distinct post-2020 acceleration patterns, while the scatter plot demonstrates significant regional variations. Nordic success, driven by comprehensive policy frameworks and early market development, has created a widening gap between market leaders and followers. This suggests that regional influence and policy frameworks are more crucial determinants of success than individual country characteristics. - Impact of Initial Market Position
The scatter plot demonstrates how similar starting points (0.01-0.05%) led to vastly different outcomes, challenging the assumption that early adoption guarantees market leadership. Cases like Bulgaria and Seychelles show that higher starting positions don't ensure continued progress, while success stories from both high and low starting positions indicate that sustained policy implementation is more crucial than initial market positioning. - Market Development Thresholds
Analysis across visualizations reveals distinct market development stages in EV adoption, with clear clustering at specific threshold levels. The progression to elite status (>70%) proves particularly challenging, achieved by few markets. This pattern suggests that advancement through different adoption levels requires increasingly sophisticated policy interventions and market support mechanisms, with distinct challenges at each development stage. - Regional Policy Framework Impact
The visualizations consistently demonstrate strong regional influences on adoption patterns, with the Nordic framework proving particularly effective through multiple pathways. Regional clustering in the heat map and tree map suggests that policy alignment and regional cooperation significantly enhance individual country success rates, highlighting the importance of coordinated regional approaches in driving EV market development. - Post-2020 Market Acceleration
Post-2020 represents a critical shift in global EV adoption, with accelerated growth across multiple regions shown in both line chart and heat map. This acceleration suggests markets have reached critical mass, with technology advancement and policy alignment enabling faster adoption rates. This pattern indicates potential for developing markets to achieve rapid growth when proper conditions are established, possibly bypassing earlier development stages.
8. Reflection
Reflecting on my analysis of global EV adoption patterns, I've come to appreciate both the power and limitations of sales share data. While the visualizations revealed compelling patterns in market development and policy effectiveness, I feel there's more to the story that could inform the autonomous vehicle industry's future. The stark contrast between Nordic success and other markets' struggles has made me curious about the human elements behind these numbers - consumer attitudes, cultural factors, and local infrastructure development that our current metrics don't capture.
Looking forward, I'm particularly intrigued by the potential of incorporating infrastructure deployment data, consumer sentiment analysis, and detailed policy implementation timelines. For autonomous vehicles, understanding these deeper layers of EV adoption could be crucial. I'm also interested in exploring how different societies overcome initial resistance to new automotive technologies. These insights could prove invaluable as we prepare for the next wave of transportation innovation, helping bridge the gap between technological capability and market acceptance.
Looking forward, I'm particularly intrigued by the potential of incorporating infrastructure deployment data, consumer sentiment analysis, and detailed policy implementation timelines. For autonomous vehicles, understanding these deeper layers of EV adoption could be crucial. I'm also interested in exploring how different societies overcome initial resistance to new automotive technologies. These insights could prove invaluable as we prepare for the next wave of transportation innovation, helping bridge the gap between technological capability and market acceptance.